

")
There is an opinion the Tactica Adversa is applied for time estimation of strong trends in any sphere of activity, which able to provide a big mass of data for the analysis, for instance, exchange prices. The next attempt «to squeeze» the price estimation in tough time frames, and successful probably.
You would find the term «adverse» in the description of Agni Yoga and in translation from Sanscrit means «from the opposite». You shouldn`t penetrate into esoteric features: put simply – in practice Tactica Adversa is a little set of graphical models and technical method with author`s rendering. The original description of Tactica Adversa (in pdf format), available on the network – is rather difficult for perception without of any specifics, but customary concepts are in the back of «specific» terms.
Only several principles of the declared «global» methodology are applied in the financial market, and the practice shows the majority of these methods are really effective for the stock market. Let`s try to separate something helpful for use in Forex.
Basic terms and constructions of Tactica Adversa
The main task of Tactica Adversa consists in the graphical determination of certain range and estimation of time probability of price movement both in the zone of constructed channel and after the breakthrough of its limits. The correct calculation shall warn forthcoming completion of the trend much earlier then achievement of this price by the trend line. The analysis is implemented on graphical constructions executed from left to right (from the opposite).
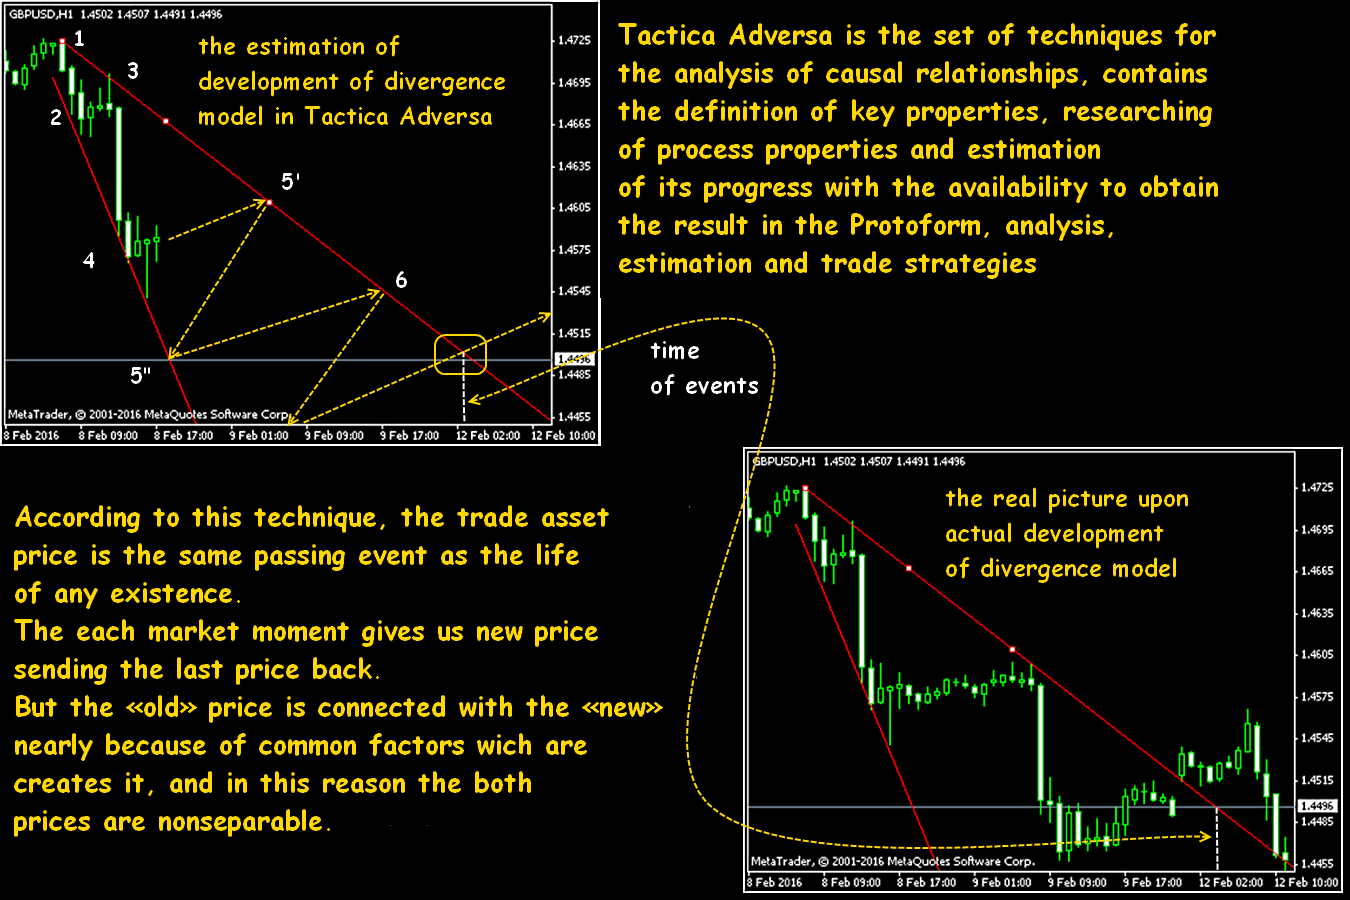
Tactica Adversa is based on the habitual principle that each global trend consists of the sequence of the intermediate ascending and descending trends on smaller periods where each odd subtrend (starting with the 1st) shall move in the direction of the main trend, and each even – against. In author's option, the constructed graphical models are named by Protoforms. In reality – the regular wave constructions created on the extreme prices.
For the first time, tactica was shown to the world on the example of the Expansion model (EM) which is considered basic for intermediate trends also now. Further, it is meant that EM describes any trend, that is the final point of each EM (6) gives rise to the following model. Other options of models are a part of global EM as correctional.
An example of the correct creations on Tactica Adversa on the ascending trend:
In application to the financial markets Tactica Adversa uses the principles, which in general don't contradict traditional trade logic:
- all patterns (models) are equivalent for trade;
- in the case of creations on several plans (timeframes) for fast (short-term) trade, the smallest model has the top priority;
- in the case of long-term – the largest.
Any model is considered «fulfilled» if the price approaches a final settlement point of creations.
Concept of a sacral point
The point of the beginning of model or a global trend is the Sacral Point (SP) or display of the Reason in this technique. The original of tactica doesn't suggest tough criteria for determination of SP but in habitual all understanding it is difficult to consider it as the beginning of a trend, because this point «is hidden» by default and located out price chart. Nevertheless, the analysis result completely depends on the correctness of its creation.
For the creation of SP from key points postpone a quantity of bars which result of calculation depends on the behavior of the price in the constructed channel. For any model, the period (sphere) of action of SP is limited by a circle with a radius from SP-6 (with the center in a key point 6). The search for that important point 6 is also the purpose of all calculations according to Tactica Adversa.
Also it is considered that the SP «belongs» to the first level (hidden before identification of the first 4 points), points 1-3 to second level (limits – two lines through points 1 and 2), points 4 and 5 – to the third (the lines are drawn through points 2 and 4), and the required point 6 belongs to already final, 4th level.
To find SP of the model you should extend to the left (back in history) to the crossing of the Trend and goals of EM. If the target line «meet» the price on an interval 1-2, then for determination of SP the target line needs to be built at a tangent to the price so that on an interval 1-4 on it were only 2 points.
The main task of SP is the forecast of time of emergence of a target point 6. Options of creations are possible:
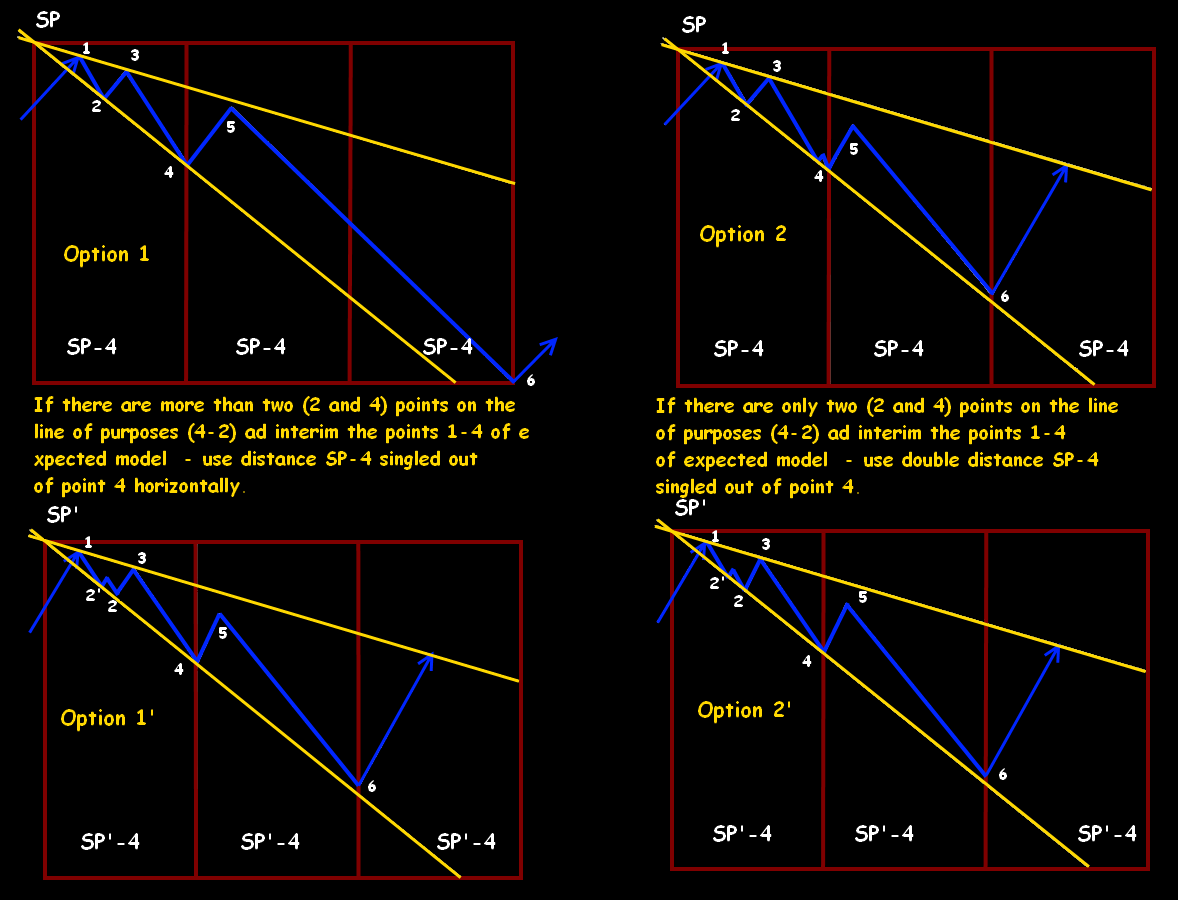
Also, the SP is applied to the determination of trend force on the available four points for creation of EM. The ratio of the distance from SP to point 1 to the distance from the point 1 to point 3 is estimated for this purpose: if the distance of SP-1 is less than section 1-3, then a trend is strong, if the section SP-1 is more than a distance 1-3, the trend is considered weak.
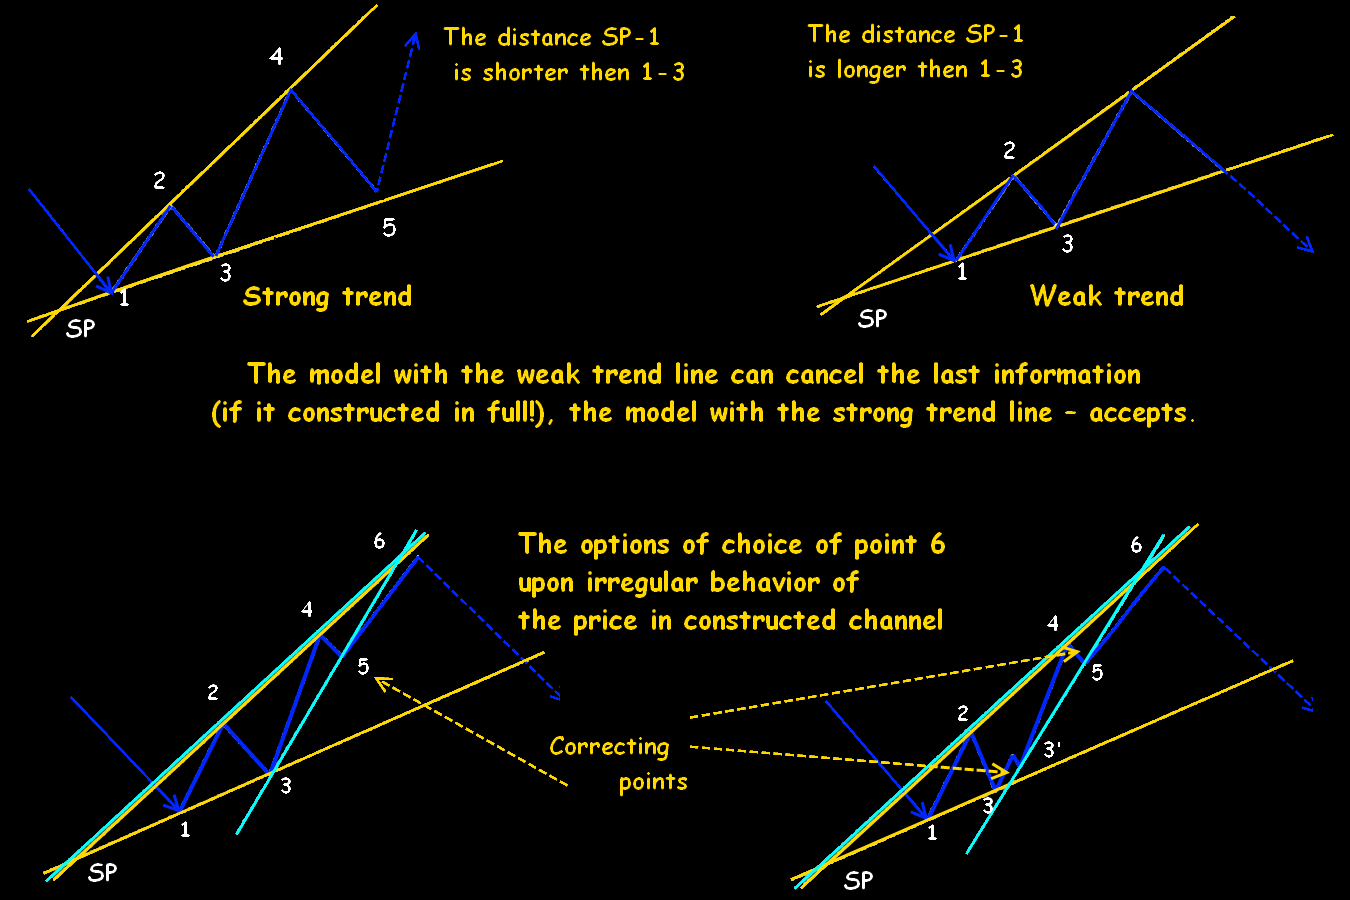
One more task of SP is a determination of the fact of change of a trend. Correction from a real turn should be «filtered» in time, therefore you should construct more precisely (and quicker) as it is possible (at least presumably!) the new SP. A situation is predicted when the subsequent model, describing a trend, replaces a previous trend in case the SP of estimated model gets to an interval between points 4-6 of the previous model.
- If the SP gets on a piece to p.4 of the previous model – we have correction model. The previous trend doesn't change, and the obtained model is only adjusted in its framework.
- If the SP gets between points 4-6, then various options are possible – it is worth to wait.
- If the SP gets to an interval after point 6 of the previous model – there was a change of a trend, a new trend rather strong and you should look for the «new» model on the bigger plan (period). Then the old model of Adversa we delete and construct the new.
An example of creation by means of benchmarks
Let's provide the scheme of forming of basic EM on the divergent trend lines. At least 4 points are necessary, two for forming the upper border line on local max and for the lower border line of the channel − two points connecting local min.
Benchmark is a regular local extremum which began to call the Fractal in an easy state of mind of Bill Williams in broad trading masses, though the true term «fractal» appeared on the market long before Williams and designates something absolutely another. In the Metatrader this benchmark will construct the Fractal indicator to us. The benchmark carries out a key role in the creation of any models.
Three extrema (benchmarks) – 2 consistently growing min and 1 max between them is necessary (see the scheme – a step 1). We construct the trend (presumably!) line through minimums and we wait for the emergence of a new maximum (see a step 2).
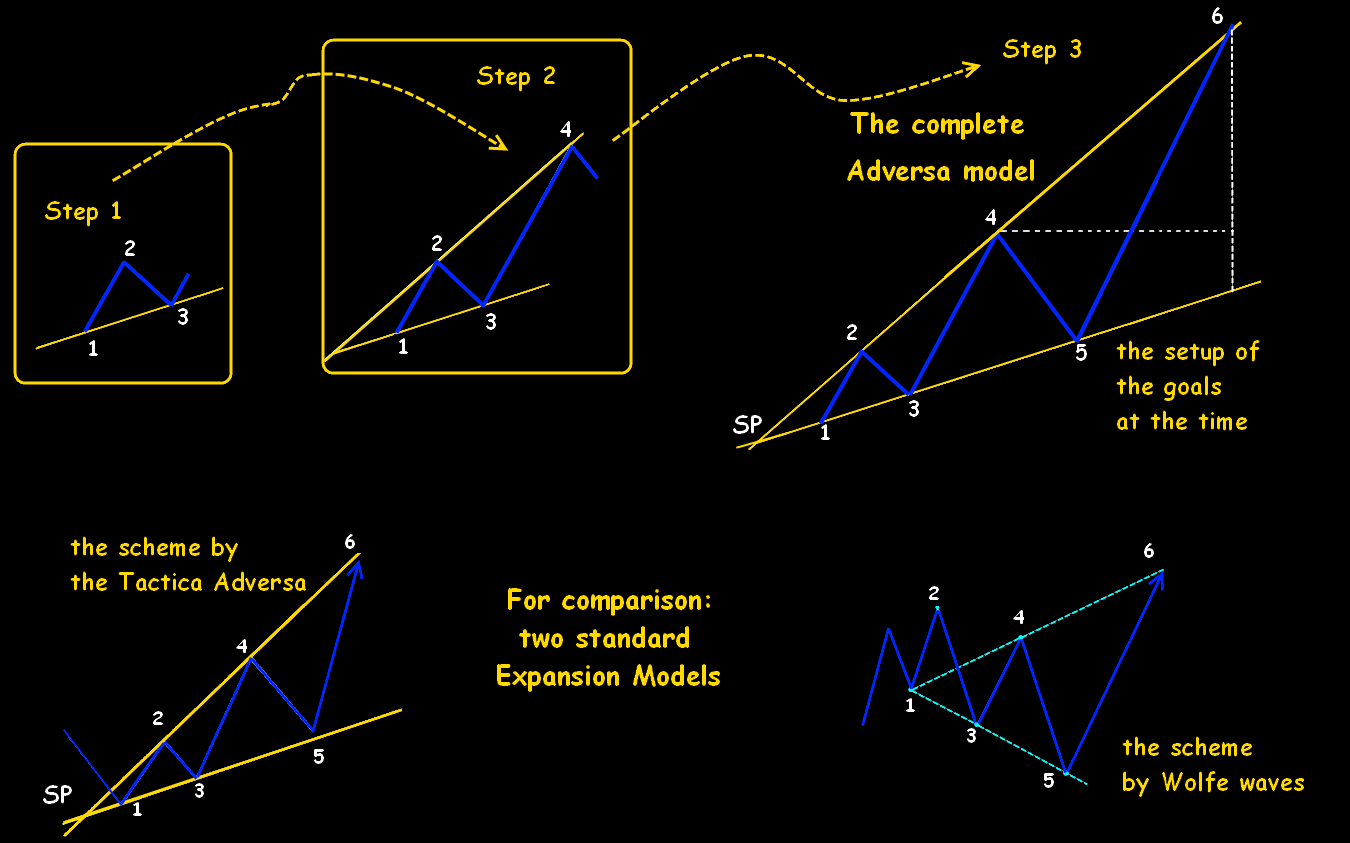
Important: the trend line constructed at this stage shan't be broken through, in this case, the expected model will need to be «stretched» slightly.
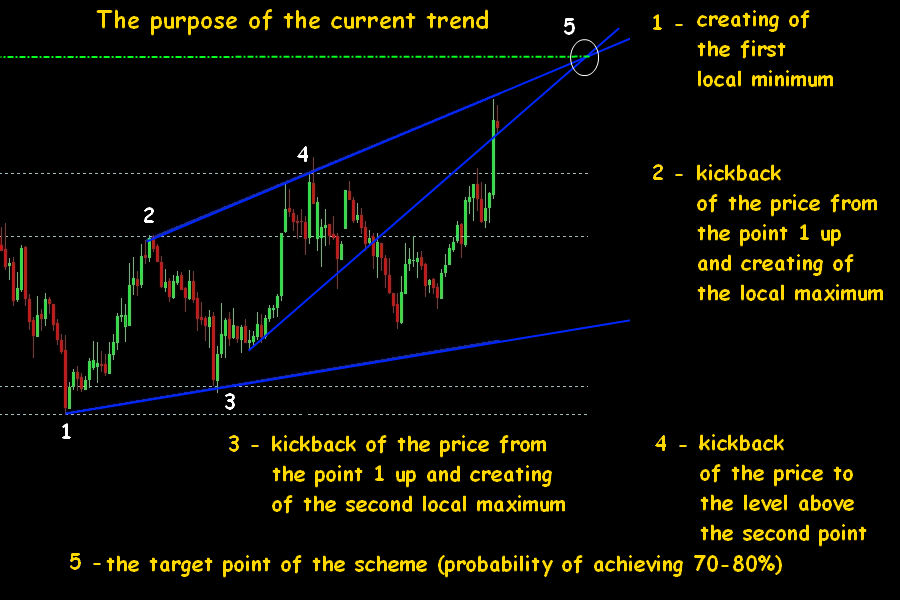
When the new maximum is created, we will construct a piece 2-4. In principle, after a step 2 the main model can be considered ready, but all the same we wait when the price «returns» (a point 5) and again will beat off the lower trend line. Only after that, it is possible to execute a so-called temporary marking according to rules of tactics (see above).
The borders of the channel constructed on local extrema well work as support/resistance levels. According to statements of Tactica Adversa authors, target points 5-6 are reached by the market in 80% of cases.
On classical Tactica Adversa, it is required to choose the first (next) possible extrema as benchmarks. If after all in intervals between points 1 and 3 or 2 and 4 over benchmarks between the line of the purposes and a trend line occurs, then the author's rendering says that you should not construct the model on this period, and it is necessary to pass to the older plan to clean over extrema.
Those few who practically trade by this technique try to choose benchmarks so that the necessary trend was located in whole between the line of the purposes and a trend line in case of any continuation of these lines. Then necessary conditions for models are practically always complied.
Expansion model
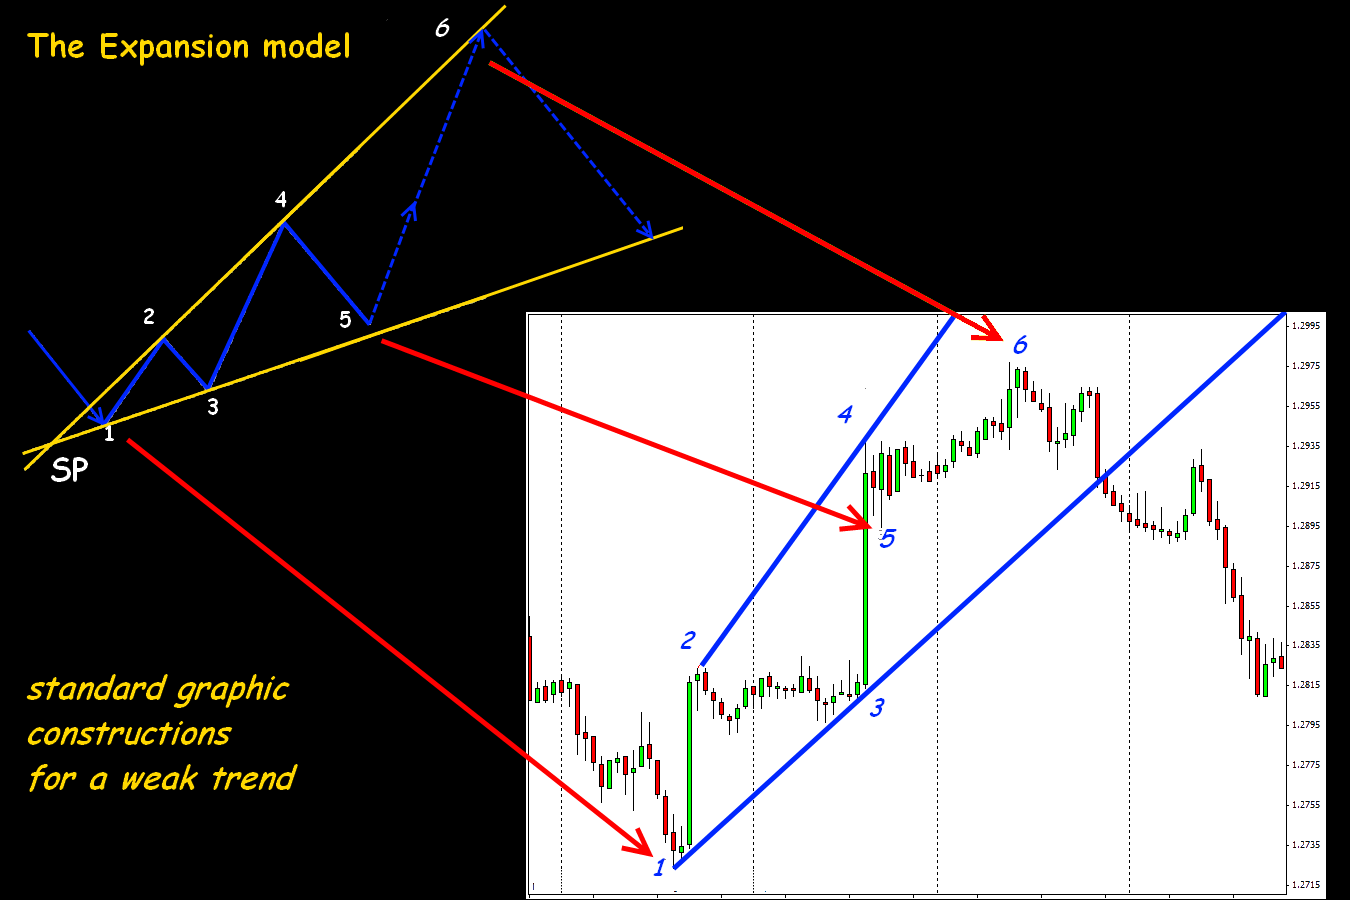
They create two divergent lines – of the trend and purposes, based on four consecutive extrema. The sequence of extrema for the creation of EM on the ascending trend max1−min2−max3−min4−max5−min6; on a bear trend min1−max2−min3−max4-min5−max6.
The beginning of a trend – p.1, the end of a trend – p.6., the line of purposes – from p.2 to p.4 and further, a trend line – from p.1 to p.3 and further. Before forming p.6 on these lines there shall be no extreme points, except key points. Calculation of the first purpose is carried out from a point of breakthrough of a trend (and breakthrough even the contact in 1 point is considered!).
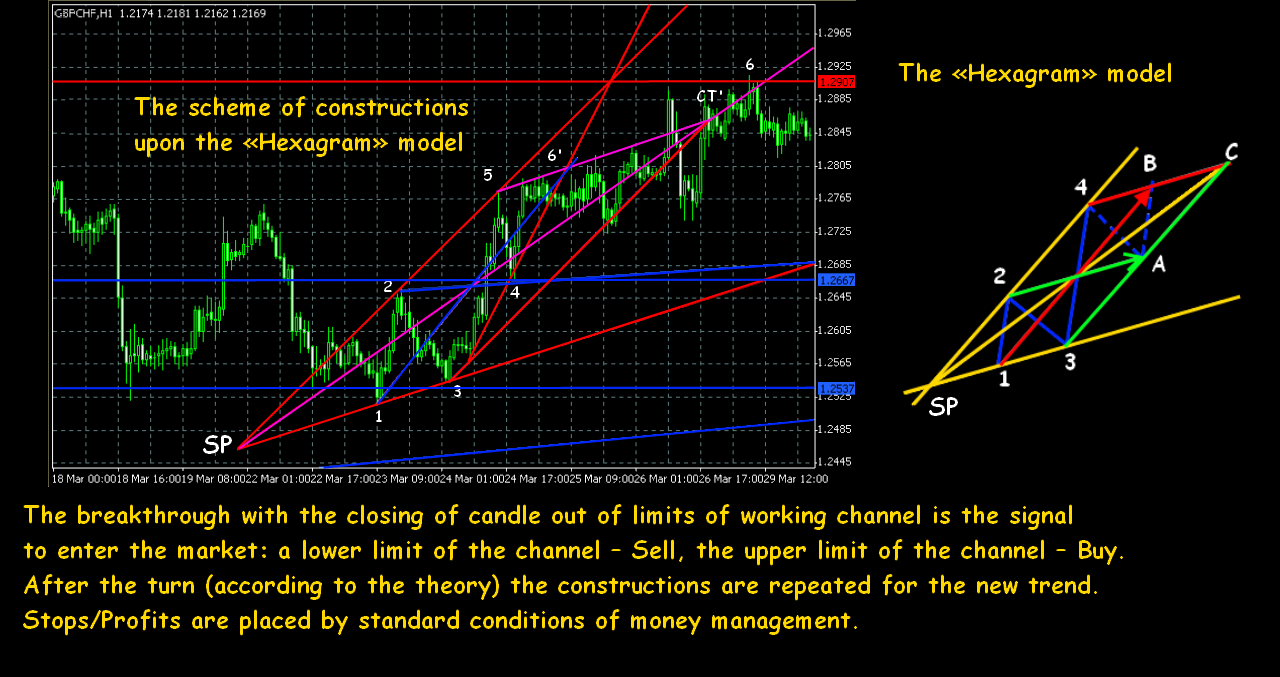
In the case of a breakthrough of EM:
- Purpose 1. Distance from p.6 to a point a breakthrough of the trend line postponed in the direction of a breakthrough.
- Purpose 2. The level of the first point of EM.
- Purpose 3. The piece 1-4 put aside the first point.
The purposes of EM can be canceled:
- if the price after a breakthrough of trend line reached p.6 earlier than the first purpose;
- if the price of breakthrough achieved the first goal for a smaller time, than was spent for movement from p.6 to the trend line;
- if ad interim the price moved from p.6 to the first purpose, the new model managed to be created.
Gravity model
According to Tactica Adversa, EM describes over 80% of market movements, that is the Gravity model (GM) working independently, but not in structure EM − the phenomenon very rare. If EM (in standard understanding) fulfills breakthrough of a trend, then GM shall determine a point of a turn (ending) of a model of the previous trend and the beginning of the new.
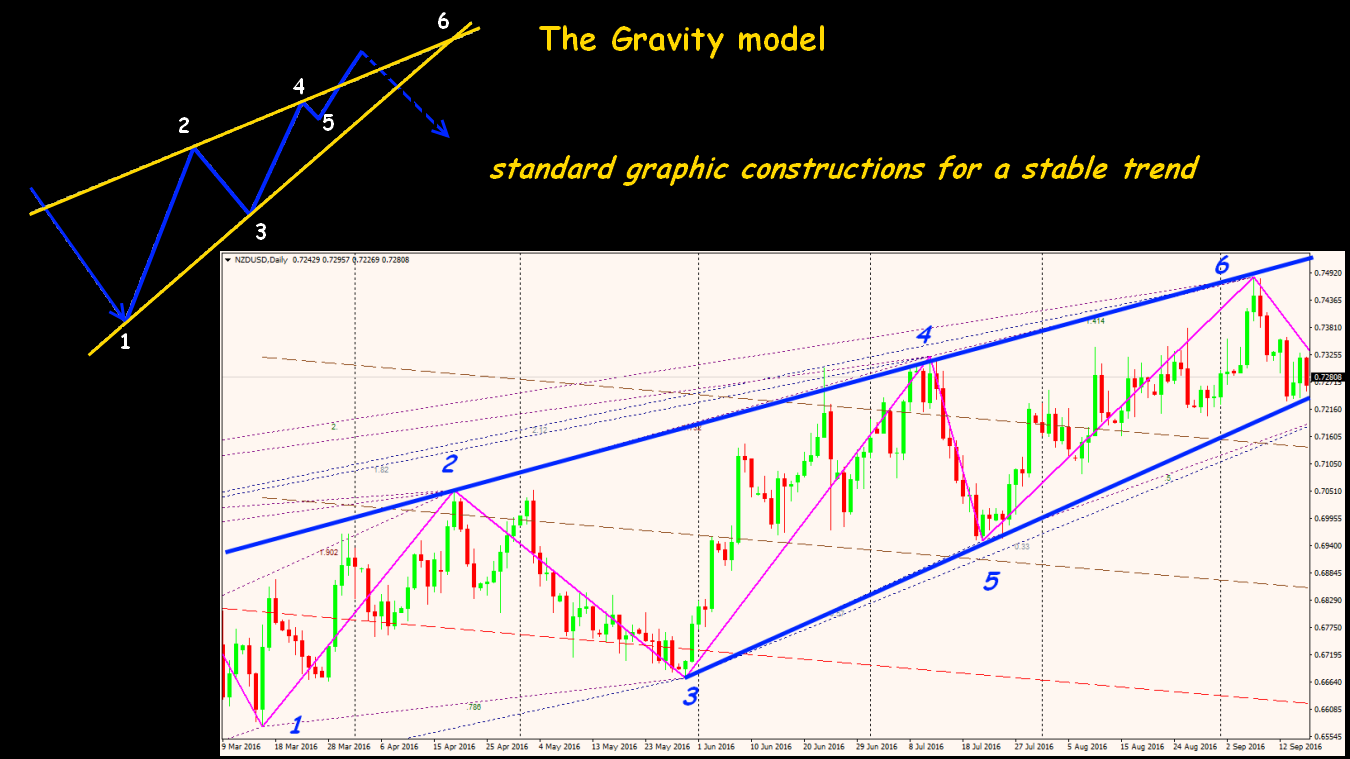
As the basis for GM is chosen p.1 – a point of a turn of the previous trend. The first correction (p.3) is the basis for the creation of a trend line 1-3. The first points of a trend line and the purposes are chosen so that lines were tangent to the main movement, so as p.2 we take a point through which we draw the line which isn't crossed by the price (a piece 1-2) in the case of its exceed to the left. P.4 of GM is a breakthrough of price level p.2 and the emergence of the following high/low.
The choice of extrema for the creation of GM on a bull trend min1−max2−min3−max4−max6, on the descending max1–min2−max3–min4–min6. The purposes line – a piece 2-4 and further, a trend line – a piece 1-3 and further. Before the emergence of all 4 benchmarks on the constructed lines, there shan't be extreme points, except the key.
Bearing model
It is used as the additional tool for determination of p.4 of EM of the older plan (period) or as support for creations on a trend. Extrema for creation are chosen also as well as in EM, the order shall be observed strictly and emergence between benchmarks of two consecutive extrema isn't allowed. In habitual understanding, such line of the Bearing carries out a role of the trend line of support/resistance.
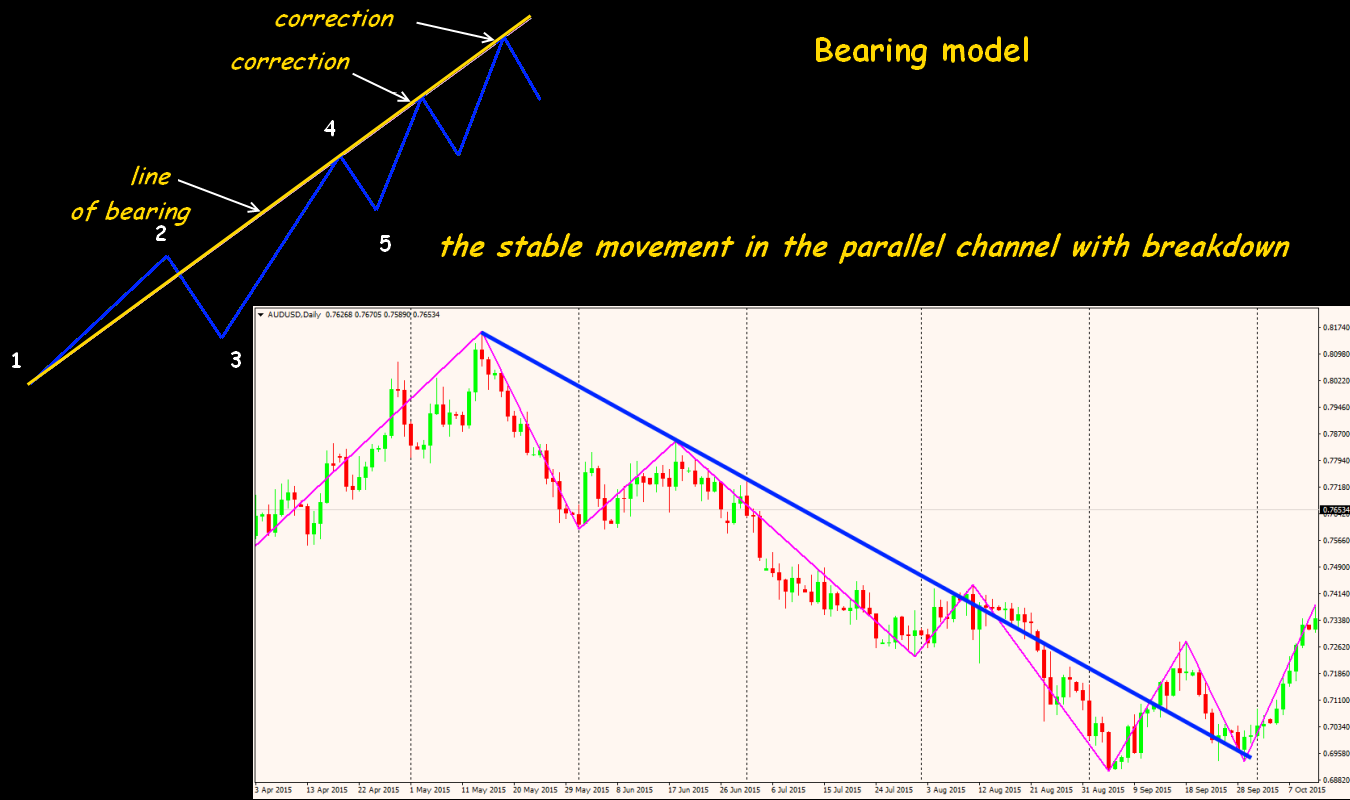
All creations are fulfilled on one Plan (timeframe). If to construct a straight line from the p. 1 to p. 4 (the younger Plan) and to extend it further to the right, then the p.4 of EM of the older Plan will be created at a point where the price in the future will concern the line of the Bearing.
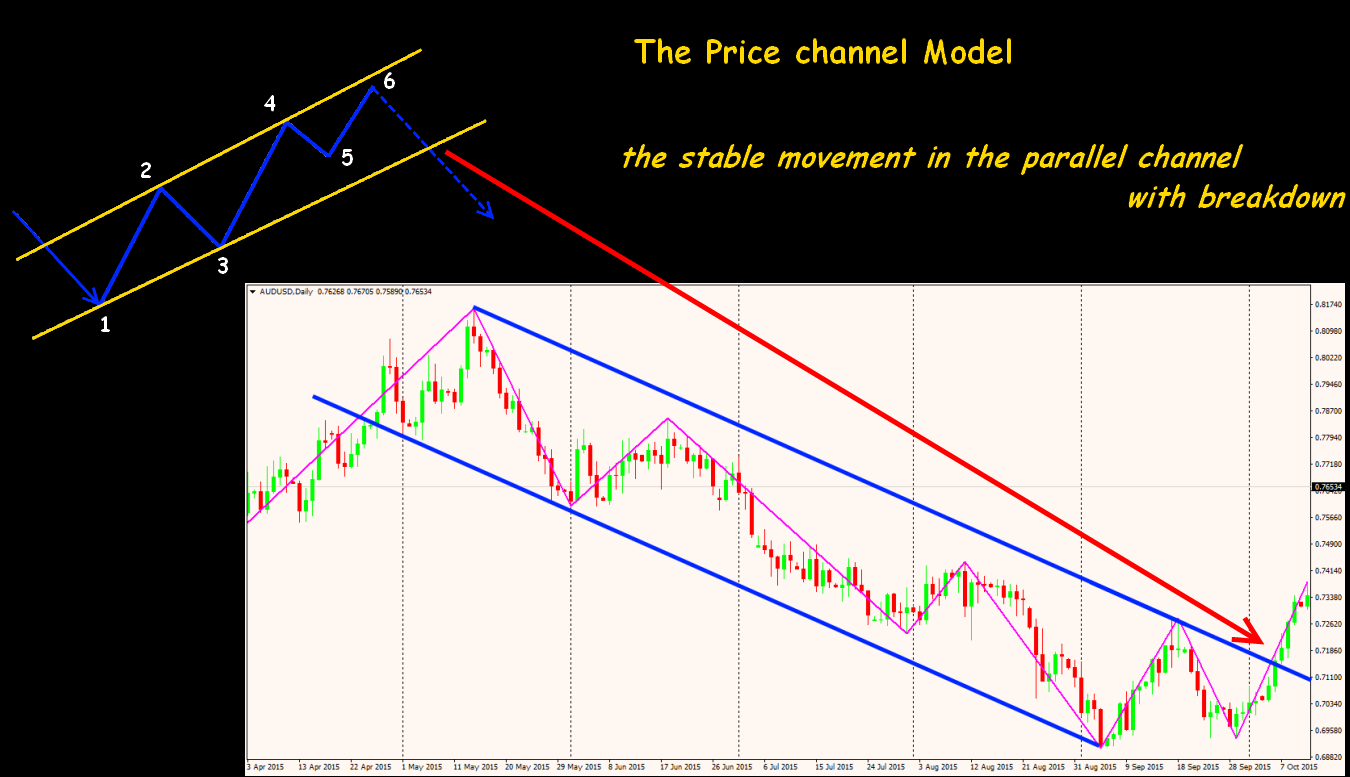
The Price channel Model
It is rendered as the model of dynamic balance (MDB) – the trend lines and the purposes lines are parallel. Points for creation MDB, and also the trade purposes and conditions of forming are similar to expansion model (rules of cancellation of the purposes – the same).
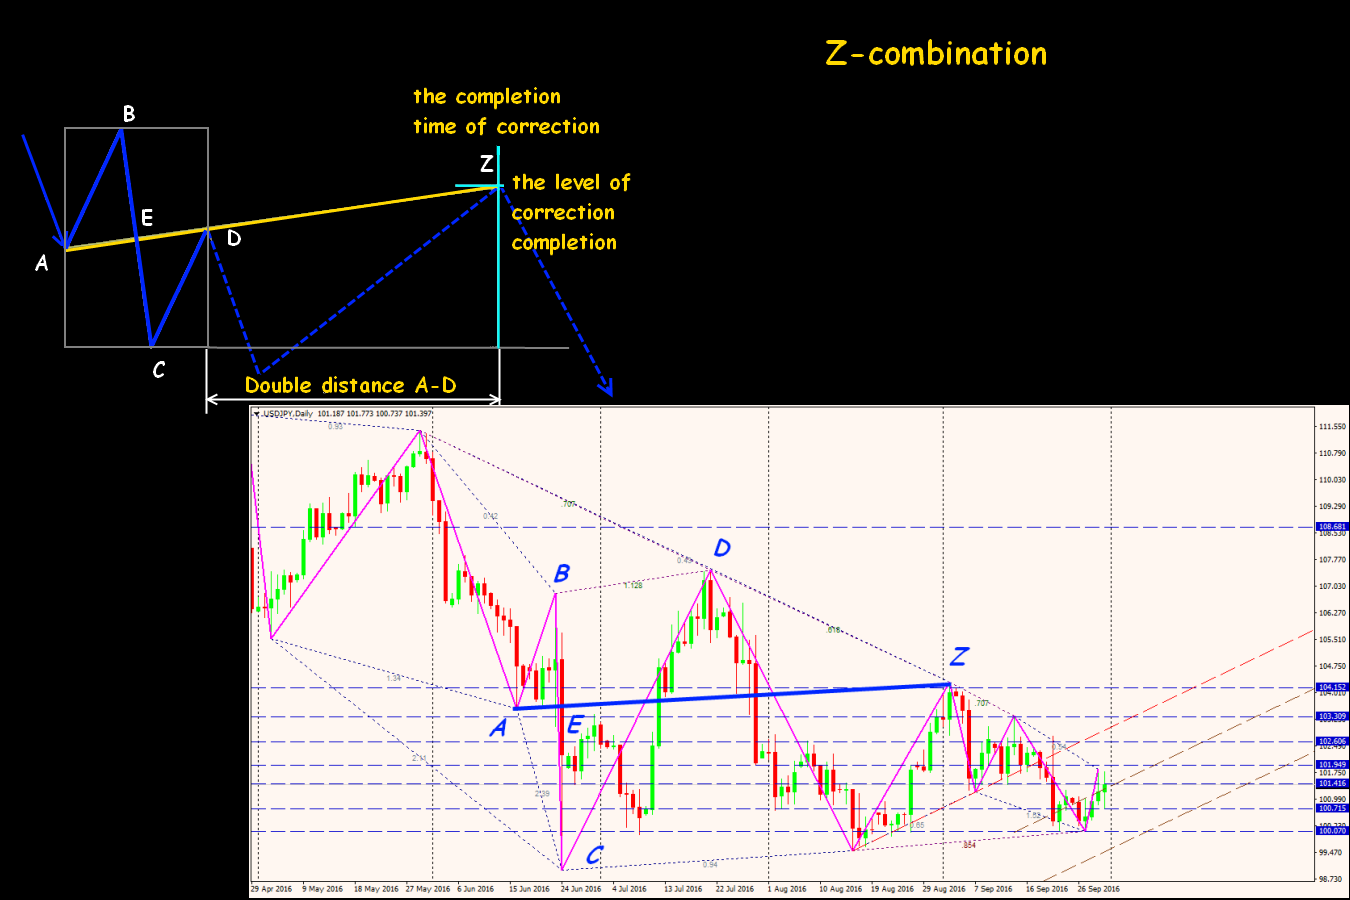
Correction models
The task of correction models – to determine the level of correction of the main trend and time which is required for the creation of this correction.
Z-combination
It is constructed on the descending trend from min (p. A) to max (p.D), and the max shall be obligatory above the min. The following ratio is required: pieces A-D and B-C halve each other (p. E), that is (A-E)= (E-D), (B-E)= (E-C). If from p.D to lay off along the line a double distance A-D, then we obtain two possible options:
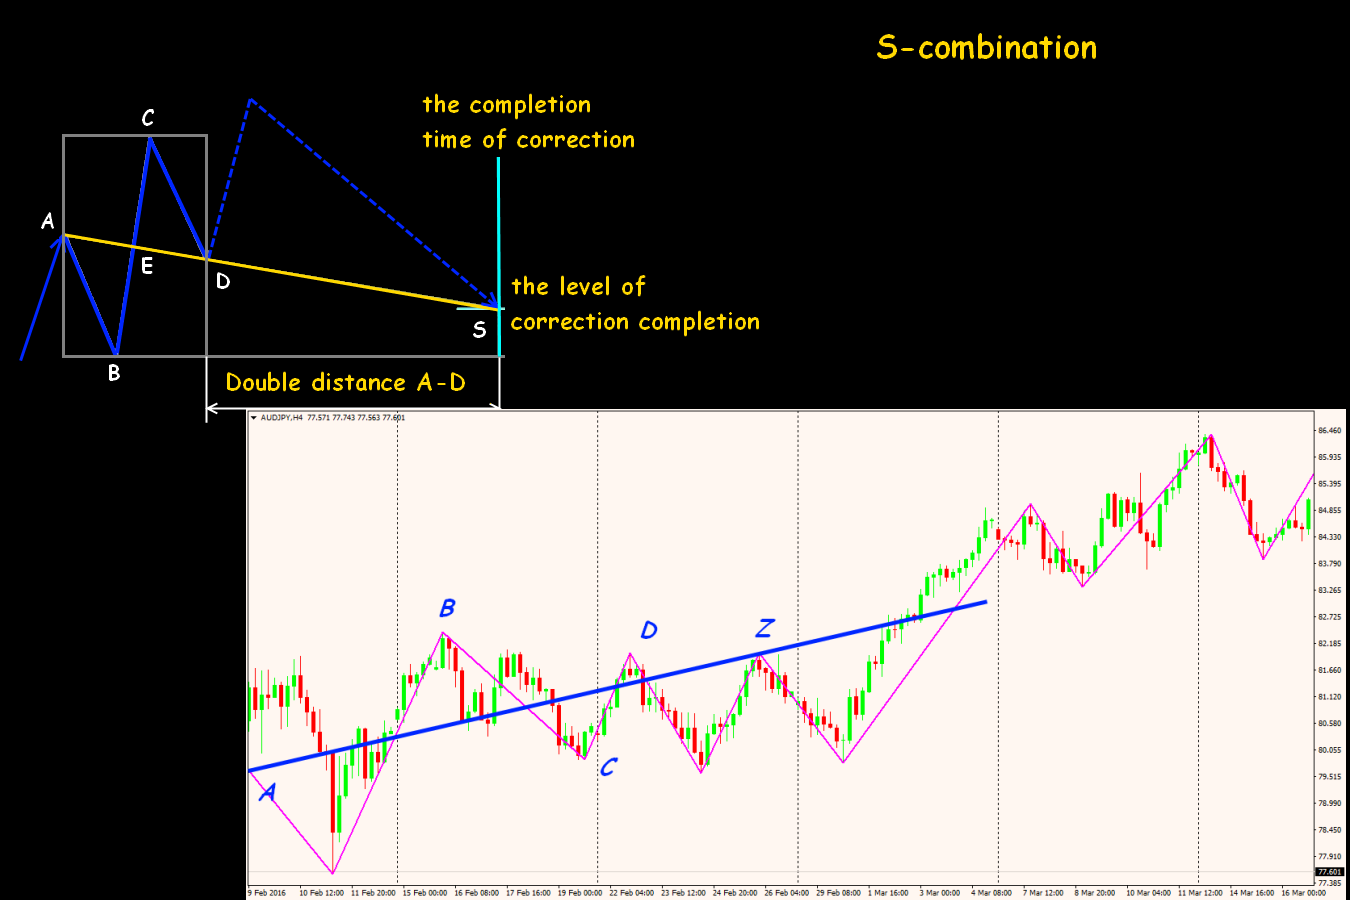
S-combination
It is constructed on the ascending trend from high (p. A) to low (p.D), high shall be obligatory above low. We observe a ratio strictly: pieces A-D and B-C halve each other in p. Е, that is (A-E)= (E-D) and (B-E)= (E-C). Further, if to lay off from p.D along the line double distance A-D, then situations are possible:
SkilFul project
The first presentation of Tactica Adversa took place 17.09.2002 at the forum investo.ru. Even the first revision of ready work wasn't available completely, only a part of methods were published (and still − anonymously), obviously, only those which have the most positive statistics on history. Later this leaving from publicity led to forming of the «…» brand (dots), since 2003 the forum moved to , and in 2004 the Original was published. It didn't add clarity for practical application of tactica, however. Everything that can be used in practice, remained the property of those who risked testing this illusive set of rules.
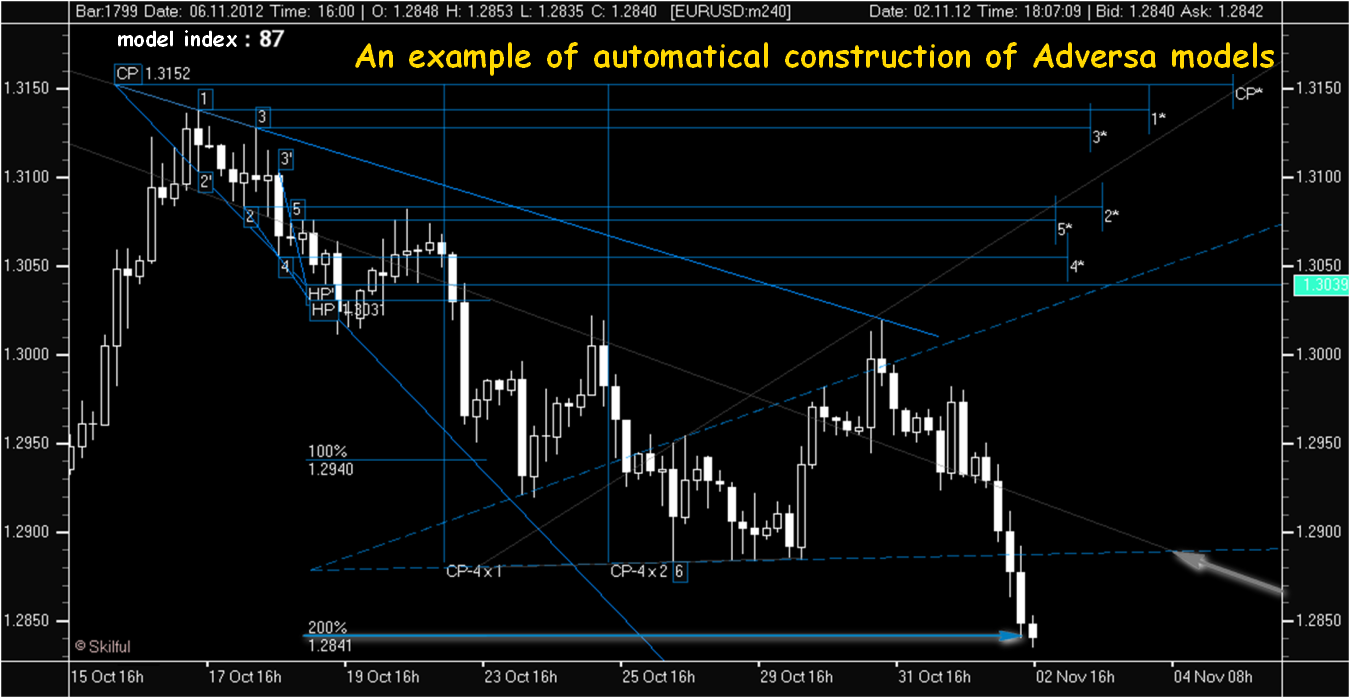
As always, all that is difficult for understanding smart people try to automate. By efforts of authors and enthusiasts of Tactica Adversa at the beginning of 2010 the Skilful project – a free software with an open code - started. And now the last release together with the Russian documentation can be downloaded freely from the project address: . The program doesn't require installation, is started directly from the archive, loads quotations in all popular formats and automatically builds all standard models. The trader needs only to estimate a correctness of creation and to choose actual signals at the moment. The program has a full range of the problems typical for the regular commercial counselor which constructs graphical models on the «net» price without amounts, but fanatics of this automatic system meet quite often.
Some practical notes
The value of Tactica Adversa for the financial market sharply decreases because its basis there is no only a market base but also accurate mathematical base. Especially as the technique works only with the price, ignoring amounts and other market information.
By itself the classical models in pure form don't meet, the purposes calculated on bars work «on time» extremely seldom because the situation can change before or because of the external reasons the market can go to long flat. In cases, when the «time» purposes aren't carried out, the technique just suggests to cancel the previous model and to calculate new, as in the regular graphical analysis.
Tactica Adversa doesn't contain any recommendations or requirements to the choice of the extrema suitable for creation of models, so, everyone chooses a convenient method: fractals, candle patterns, Fibo's levels and so on. Timeframes for such points may be very different, and you should apply average time of forming of a turn in a method of calculation of key points of Adversa. And how to determine it by regular methods which don't work with the concept «time»?
The given (and constantly updated) trade examples in public descriptions of Tactica Adversa are looking too obviously adjusted on history. The technique has obvious similarity to Wolfe-Elliott's waves, so it`s just dangerous to look for the «trends» «/subtrends» recommended in it on the period below H1, and a technique for creation of borders of the channel on extreme values in the modern speculative market doesn't make a sense. Any news throw «breaks» all constructed models and it confirms by the SkilFul software.
If to try Tactica Adversa in real after all, then it should be done only in case of long-term trade not below D1, with obligatory control of breakthrough (in traditional understanding!) the constructed borders of the channel on the charts W1 above. That is – not to do without a traditional technical analysis.
And as the conclusion …
After all the esoteric component of Tactica Adversa (frequent and not quite pertinent links to Blavatskaya and Roerich, metaphysical terms − «protoform», «a sacral point») looks bad farfetched. In practice, the methods described above are also ambiguous, as well as all others. Movement of the prices in the market, perhaps, also is a part of the Creation, but has simpler, quite physical explanation.
If to clean a human factor from the market (simply speaking – speculators), then schedules will turn into a regular average value which will move on the sinusoid reflecting global economic cycles. Because of speculators in each point of time the price is under «pressure of speculative amount» and «aspiration to balance». The balance of these forces is also an essence of those «benchmarks» which together with a turning «sacral point» reflect the current intentions of the market.
Tactica Adversa, perhaps, is interesting as the philosophical theory, but the imagination is obviously necessary for trade on it – even automatically constructed schemes are difficult for understanding technically, and that is important, – psychologically. But if not to pay attention to advertising exotic, then it`s quite possible to use a technique for the long-term estimation on any assets especially as it constantly develops. And, perhaps, everyone finds in it something special.
Social button for Joomla