

")
The main idea of the Dow`s theory («history repeat») is constantly criticized, however, traders continue to look for on the price schedule the constructions which can be treated unambiguously and applied for the entrance to the market. We offer graphic Forex patterns demanding independent way of thinking, but increasing chances of success.
Standard graphic models are described in detail long ago, and in the market, all «see» them almost equally. Those who has no million capitals or fundamental ways of influence on the financial market should look for themselves trade advantage in the sure technical analysis and original approach to the market. We will begin with the most beautiful, rare and ambiguous:
«Diamond» Forex Pattern
Rare, but very strong «Diamond» figure (or «Rhombus») means a condition of market instability – almost equivalent periods of growth and falling, therefore, chances in both directions are considered as approximately equal. But the breakthrough, finishing model, which will be used for an entrance the market, will happen surely.
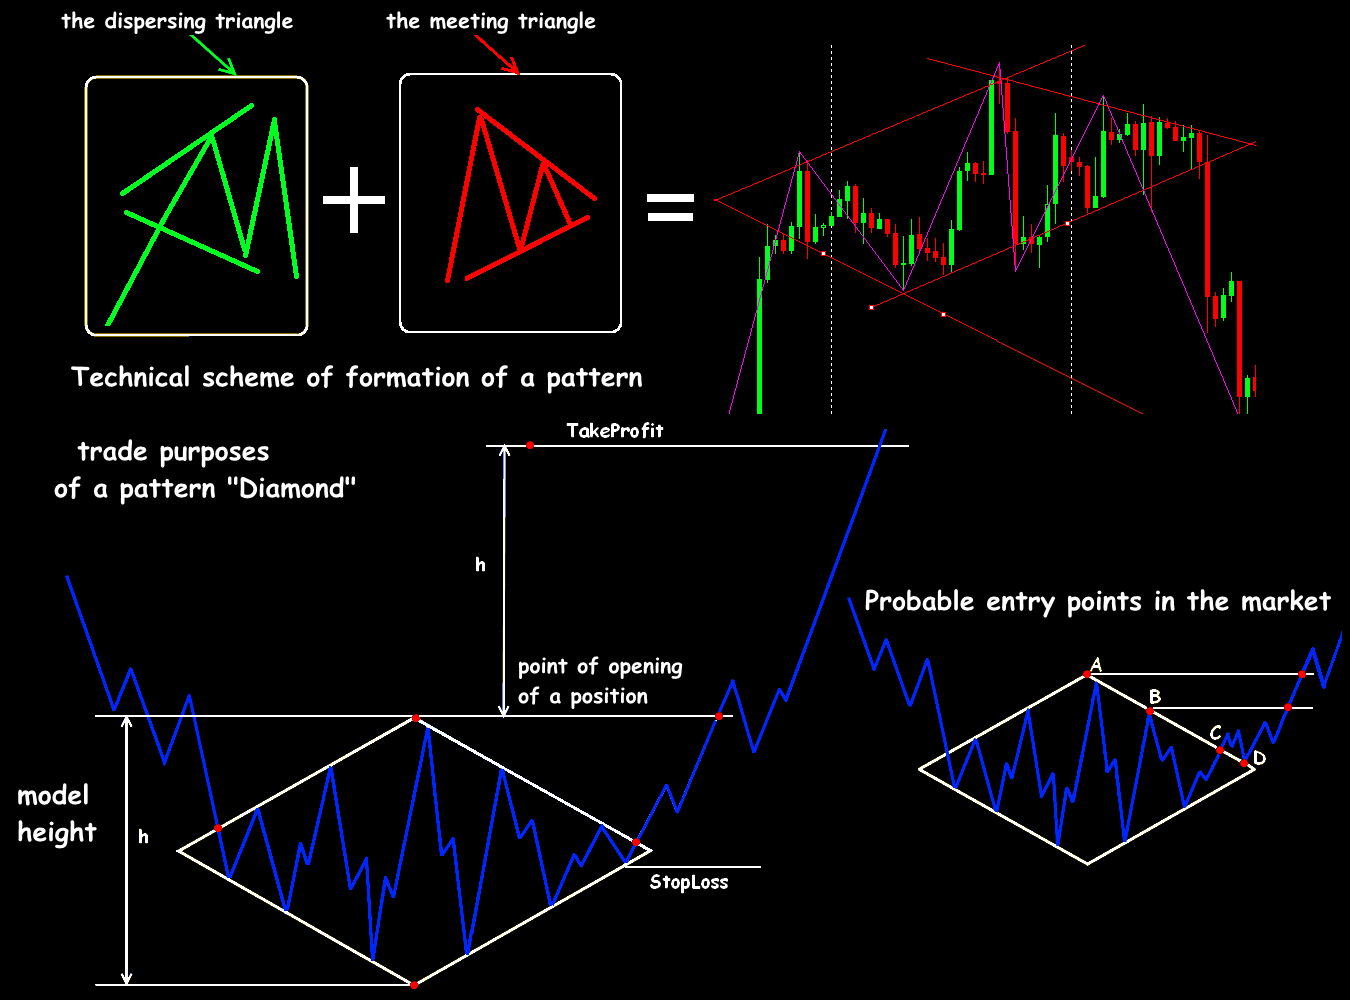
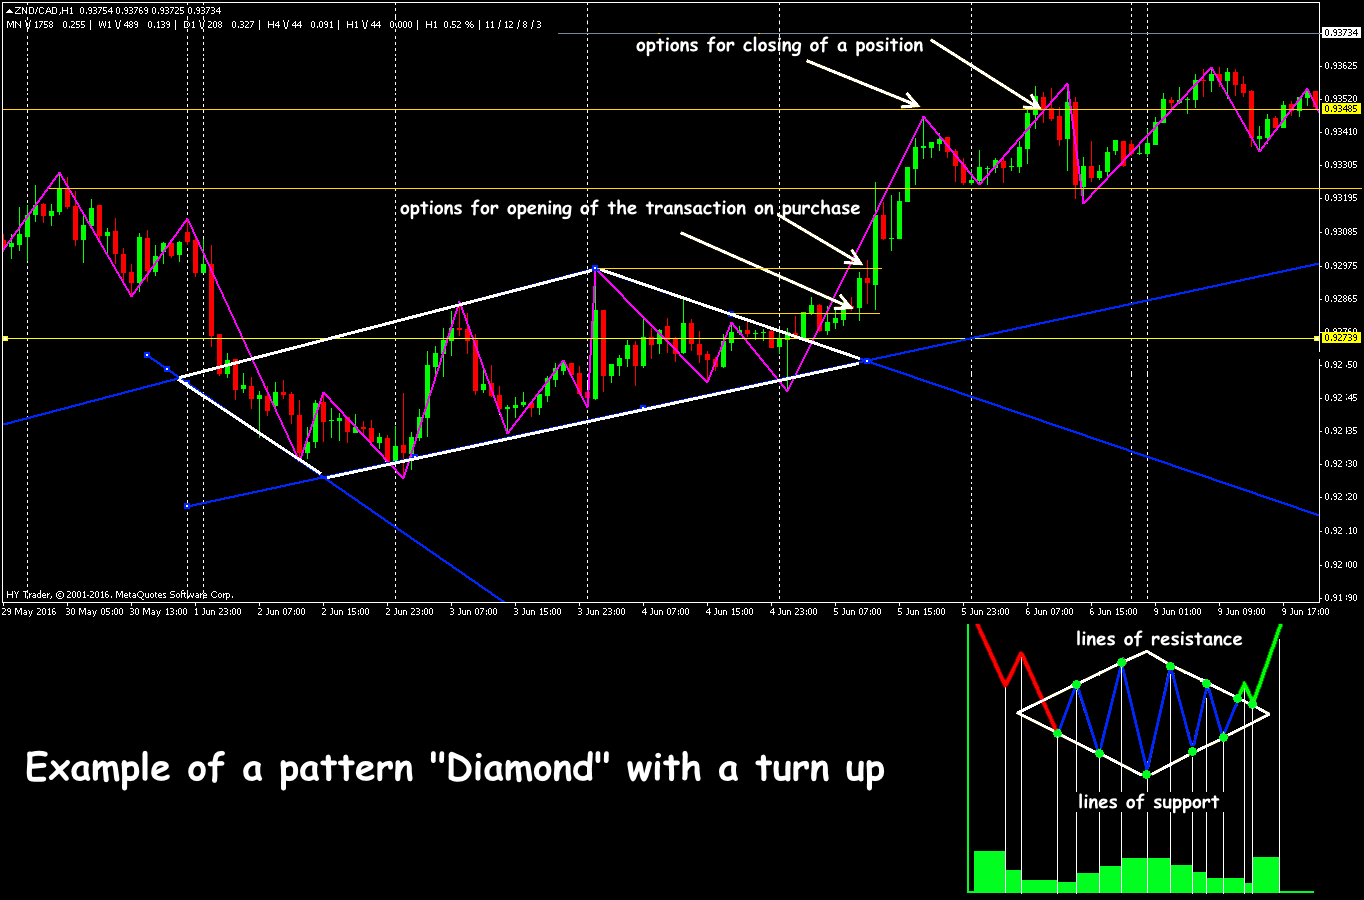
Technically the «Diamond» pattern can be divided into two sites – the extending and converging triangles with the common tops, therefore, the closed figure, which borders are considered as lines of support/resistance, turns out. A price exit out of the ready model and the opening of transactions is carried out by rules of a triangle: in case of a breakthrough of the lower bound – for sale, top − on the purchase.
The «Diamond» model is formed as a «bear» turn (down) − in the top range of the price or as a turn of the descending trend up − at the bottom of the market, and the pattern in the bull market is constructed much quicker than a figure in the basis. Just because players always sell assets much more willingly, than buy, the «top» model always contains the periods of bigger volatility. The dispersing site has to consist of three waves, at least, and the model most often comes to the end with two strong compressions. The more number of fluctuations get to a pattern zone, the more strong movement is expected at the exit. There are periods of relative consolidation inside a figure – an accumulation of small fluctuations in a central line zone.
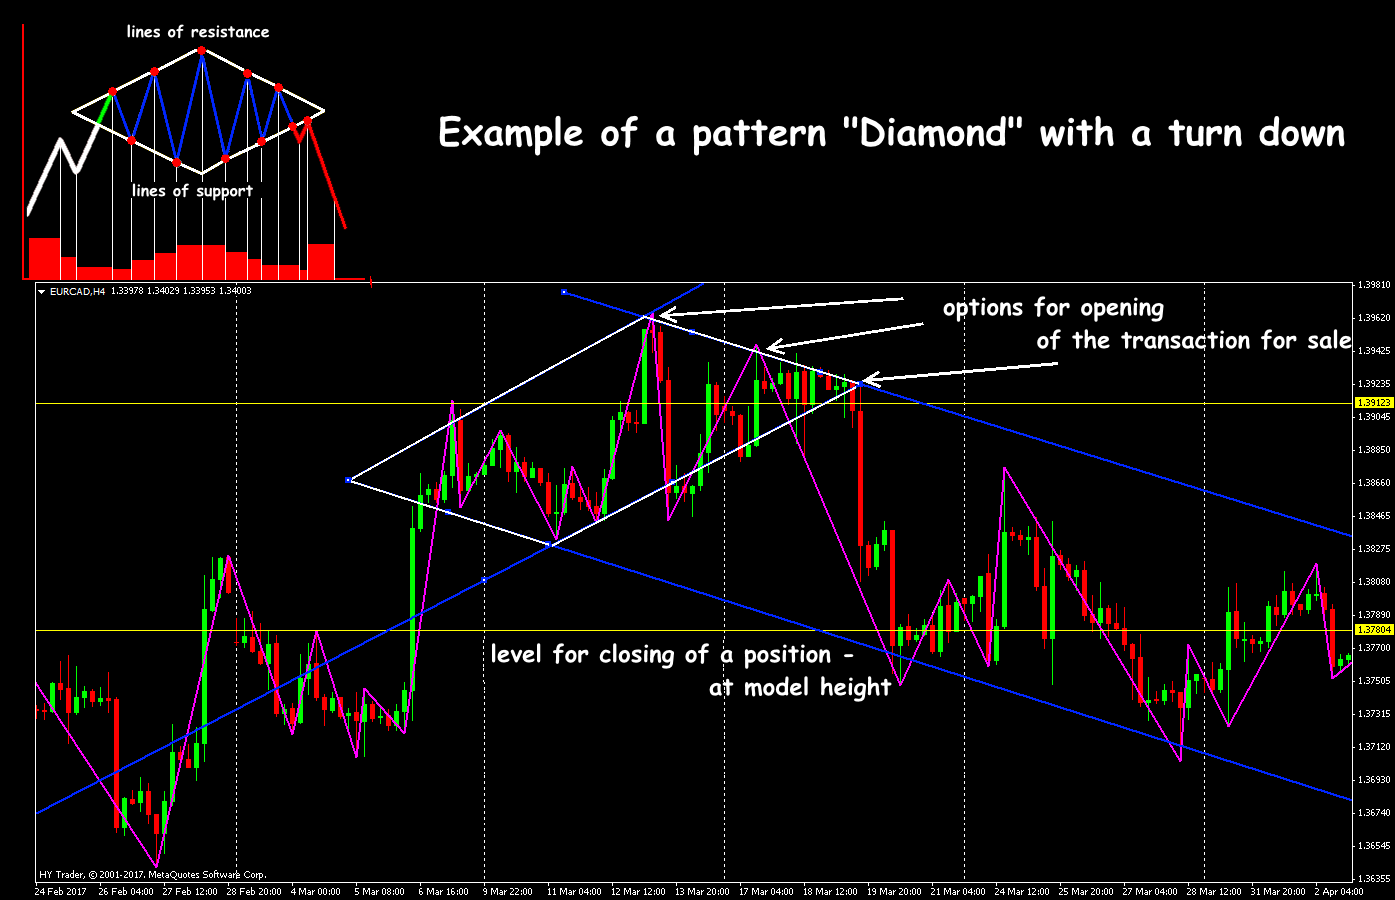
The figure of correct «Rhombus» when the period of growth is approximately equal to the falling period will be the most reliable. On the time frames from D1 above a Forex pattern, most often, works for a turn. On the small periods, it is hard to identify «Diamond» at all, but if it appears, then with a high probability it needs to be treated as a model of trend continuation. The reliable signal requires confirmation by dynamics of trade volumes − according to the scheme which is identical to all «Diamond» options, irrespective of the direction:
- At an expansion stage (the first 2-3 waves) volumes are slightly higher than the average value, and on the way to the central extremum – decrease.
- On the site of the converging triangle, the growth of volumes on the lowered volatility is expected (a set of transactions in both directions).
- At the time of border breakthrough the volume sharply increases (buyers and sellers hurry to open transactions in the direction of break).
The entrance to the market can be executed in several cases:
- just after the breakthrough of a pattern border (for purchase – up, for sale – down), it is more reliable – after closing of a candle behind the trend line;
- above/below model extreme points;
- above/below the model last key point;
- after a retest of the border which was broken through.
We open transactions only in case of the completely created model. Signals according to the scheme 1 and 4 are considered as the most reliable.
We place StopLosses at the level of the last extremum (short option) or under the general model extremum (more conservative option).
In case of Forex «Diamond» pattern fulfillment, the first target point settles down at distance of the general height of model (from a breakthrough point). It is recommended to transfer the transaction in the black as soon as possible and further to fix a profit gradually. The figure is fulfilled very seldom above a target point. Minimum recommended time frame for the analysis and an entrance – not below H1, for support of the transaction – not below H4.
The «Brilliant» model sizes can be rather big, but trade in the created figure is considered risky and it isn't recommended to beginners. If «Diamond» appears on the period of D1 or above, then in case of rather rigid money management it is possible to trade on the small periods according to usual techniques, but at the same time, you have to control the general model.
All options of the «Diamond» model, despite the long period of formation, are unstable constructions and can be «broken» at any time.
Forex pattern reliability decreases because of speculative volatility, especially as it is difficult to identify it, and constantly there is desire such figure visually «to finish drawing» − without the corresponding confirmation. For instance, «Head Shoulders» which gives a strong turning signal, but much later, than correct «Diamond», is very similar to such pattern. It can lead to the earlier entrance to the transaction and, as result, – to serious losses.
For real trade, a «Diamond» Forex pattern has to be created completely, fulfill necessary conditions of a trade signal and then medium-term transactions can make a quite good profit.
«The quickest» of non-standard
«Thorn» Forex Pattern
Such symmetric models are called spikes or V-shaped Top/Bottom. They look like «Hammer» candle constructions (or «Hung up»), though actually it is hypertrophied option of the «Head Shoulders» model. They work as turning, but rather problem figures – it is difficult to distinguish them from situations of usual correction, and technical indicators, such as oscillators or traditional movings, don't help with such cases because always delay real prices dynamics.
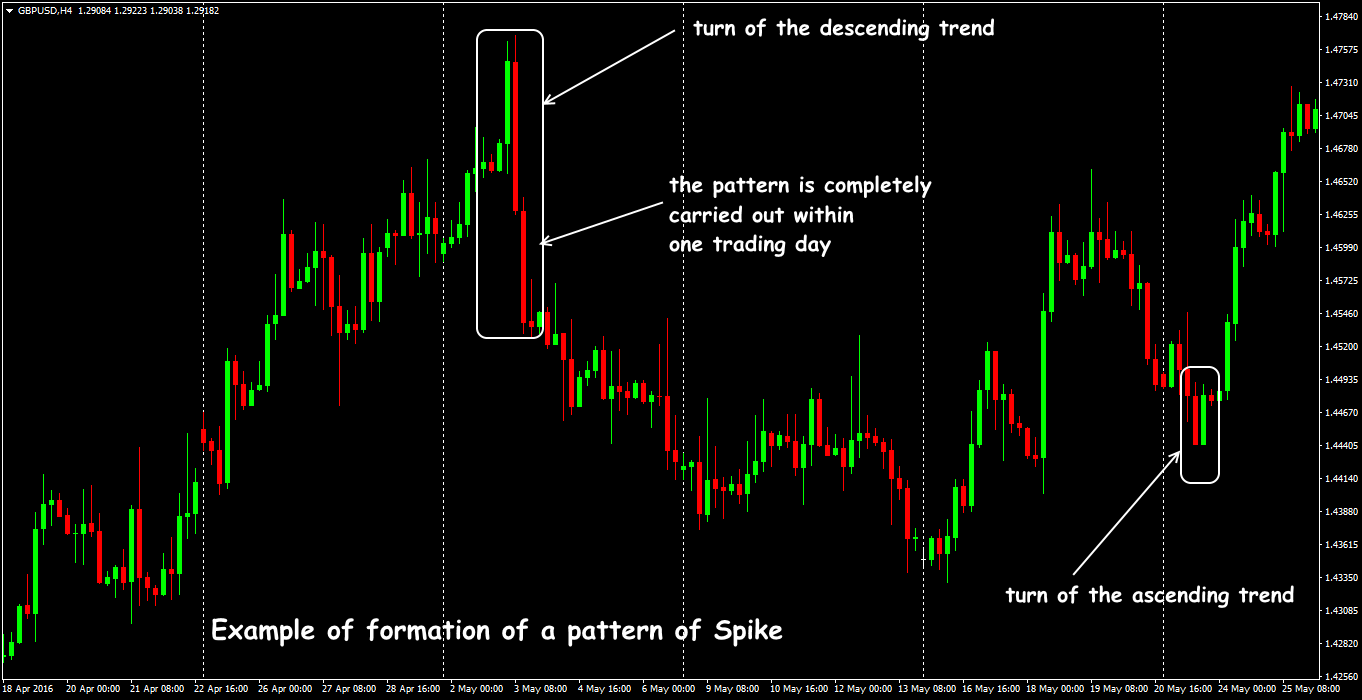
«Thorn» Forex pattern is a sharp movement of the price in the strong direction, with the same fast return to the previous level. It is usually formed during the trading day, sometimes only 2-3 price bars are necessary, and at the same time there is no consolidation of the price at all at the top (or the basis) of the model for this purpose.
Technically spikes are caused by an excess of Forex speculative transactions volume over actual exchange volumes, for instance – currency or index futures. The higher time frame on which «Thorn» is formed, the stronger it potential.
Jack Schwager was the first who has begun to analyze spikes in 1995, he has offered the first criteria of an entrance. «Thorns» reflect the real crowd psychology – spontaneous acts and panic. The speculative market reaction is supported by small players who haven't managed to enter on the first sudden throw, therefore, on kickback urgently close positions to lower losses. Fundamental factors (news, force majeure, political events) are usually the reason, the first reaction to which is too exaggerated, and after real assessment of the situation the price quickly comes back – the first short-term correction can be up to 50% of breakthrough range.
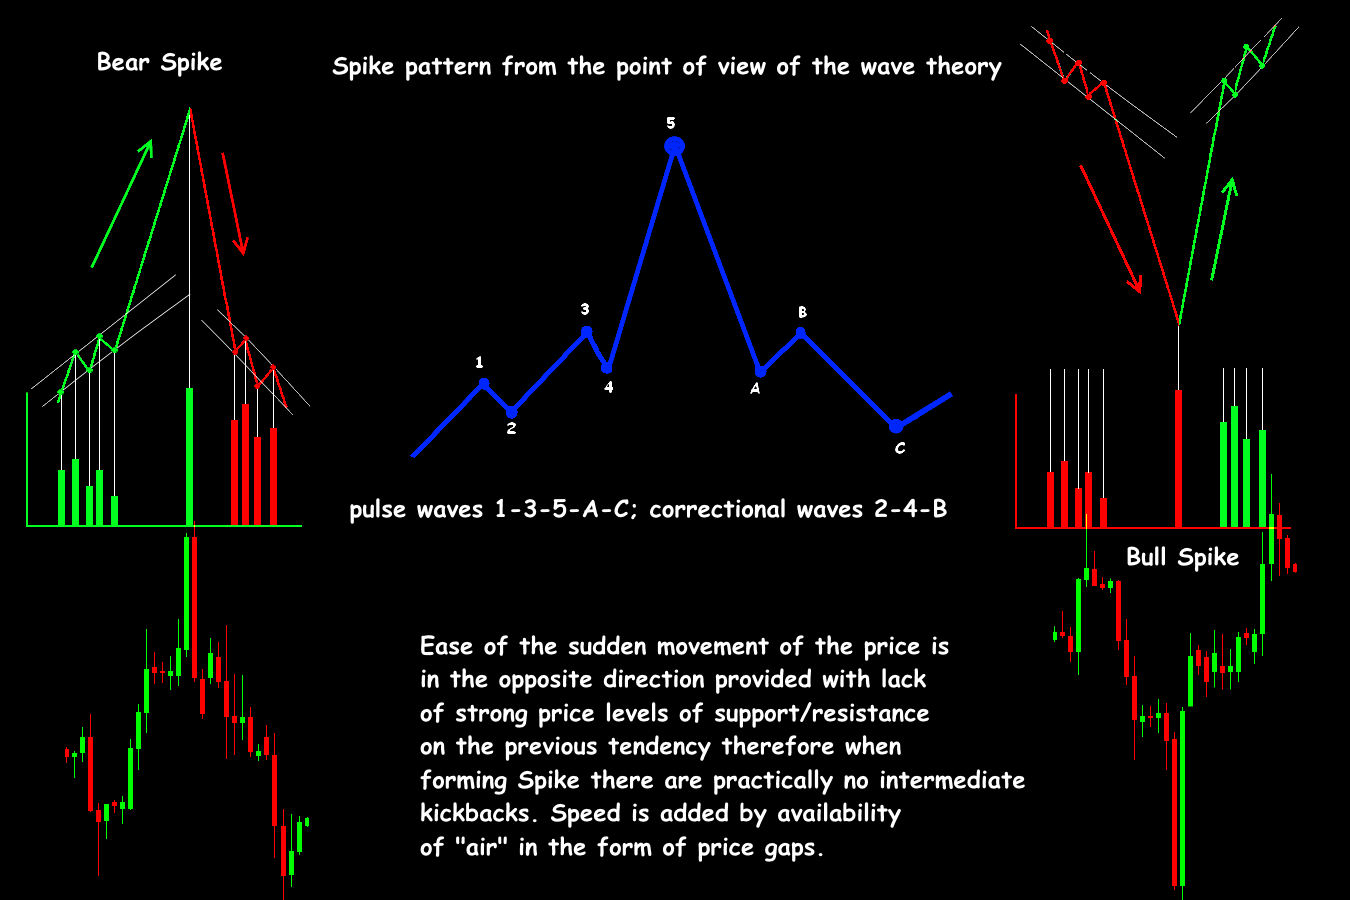
Spike range can reach hundreds of points, and on both pattern sides, there shouldn't be price fluctuations. From the point of view of Elliot`s wave theory, the «Thorn» corresponds to the extended fifth wave after which there is a turn and further the standard correctional ABC model is formed.
The model is formed very quickly, on speculative volatility and large volumes, and therefore trade is risky and nervous. Though as a result of «Thorn» formation the probability of a trend turn rather high, there are almost no accurate criteria for the definition of an entry point and the TakeProfit/StopLoss parameters. Most often «Thorn» is used as a strong auxiliary signal for the definition of the strong direction, and the entrance is carried out on more exact technical signals.
The «Thorn» Forex pattern is considered a speculative figure − before its formation there shouldn't be an essential consolidation in the market, and just before a pattern decrease in trade volumes is observed. The model amplifies if there are in the market:
- a strong trend before pattern appearance;
- a gap between a «Thorn» final point and the previous extremum;
- the long shadow of a basic candle.
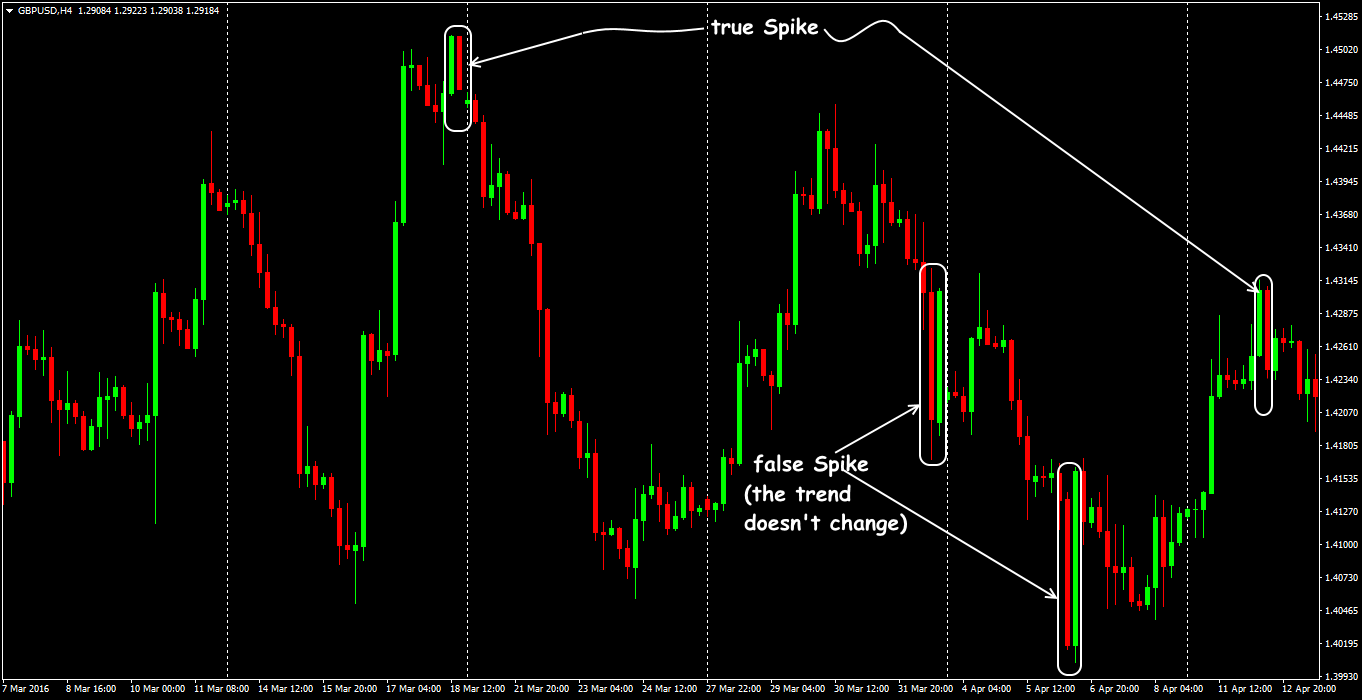
Sometimes the price can continue the movement after formation of small «Thorn», and the turn occurs on the 2-3 candle. The last extremum before model appearance is considered the support/resistance price level.
Classical StopLoss is placed above/below a final point, but not less than the 61,8% Fibo`s level of the «Thorn» range. We put the first TakeProfit on the height of «Thorn» from an entry point − we will transfer the transaction in the black, the second TakeProfit – on 2 model heights from an entry point.
The «Thorn» structure can be created as a gap (or their sequence), without obvious basic levels. The «Thorn» pattern can develop descending («bull Spike») or growing («bear Spike») trend. They still allocate expanded option of a V-shaped pattern when after the main falling some accumulation of the prices, most often, in the form of «Flag» with an inclination to the opposite side, is observed. It means that some time market participants try to hold the market from sharp growth/falling.
«The Double Thorn» can be considered as a more radical option (PipeTop/PipeBottom) – turning model from two (sometimes − several) next bars in the form of price spikes of the different direction, but about one size located in parallel each other. The optimum period for such construction – week. The turn of a trend occurs as fast as possible, without intermediate candles, the «bear» spike option is considered more reliable. If the volume on left spike is more than average level, and on right – less than average, but at the same time the right spike is longer than left – the signal amplifies.
It is difficult to trade on such figure even to professionals, and it isn't recommended to the beginning players at all. At experience, it is possible to try scalping, but only on the postponed orders and after the careful preliminary analysis. It is recommended to use a trailing for protection against losses and profit fixing, of course, if your broker moves your StopLoss after actively «running away» price in time.
Non-standard flat or
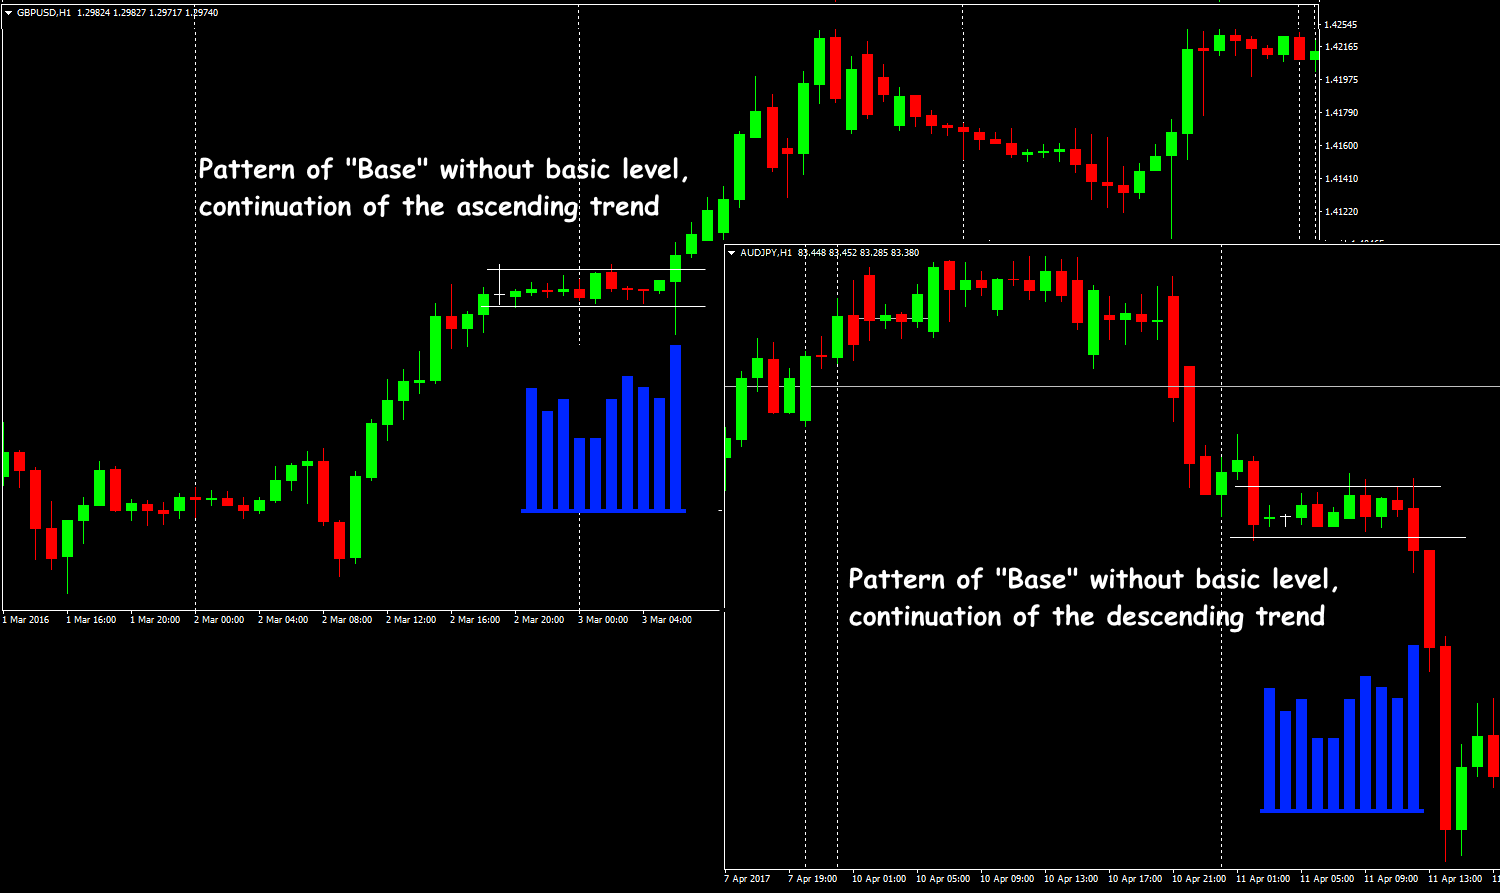
«Base» candle pattern
One more successful setup Price Action adapted for Forex from the stock market. It was called because of special price behavior which bargains in the very narrow range that reminds creation of some foundation («Base») for the subsequent strong movement. In case of correct identification breakthrough of such channel in 80% of cases will provide a stable profit, at least, on 5-10 candles after the border of «Base».
The model is formed almost on any time frame, but the most stable and «liquid» are considered H1 and H4. For trade, any assets with stable volatility are recommended.
The «Base» Forex pattern means that the market has temporarily stopped, but it hasn't fallen asleep too «deeply». Externally it looks as usual consolidation, but has several special requirements:
- the strong price level is required (a cost zone) that should be confirmed with additional indicators;
- «Base» range has to be really narrow − from 5 to 50 points (depending on a time frame, of course), but no more than 10-20% of the trade asset daily average volatility;
- the model has to have not less than 3, but no more than 10 bars (it is optimum – 6 candles);
- price dynamics has to be confirmed by characteristic volumes dynamics.
The «Base» best pattern has to have a rigid price channel, an exit of candles «body» behind its borders isn't allowed, exits of candles «tails» out of channel borders are admissible, but no more than 30% of the channel width. The entrance is usually carried out on the 3-5 candle, StopLoss is put on 5-10 points above/below than an extreme point of a candle shadow as a part of the model.
«Base» pattern coordination with ordinary technical indicators – is obligatory!
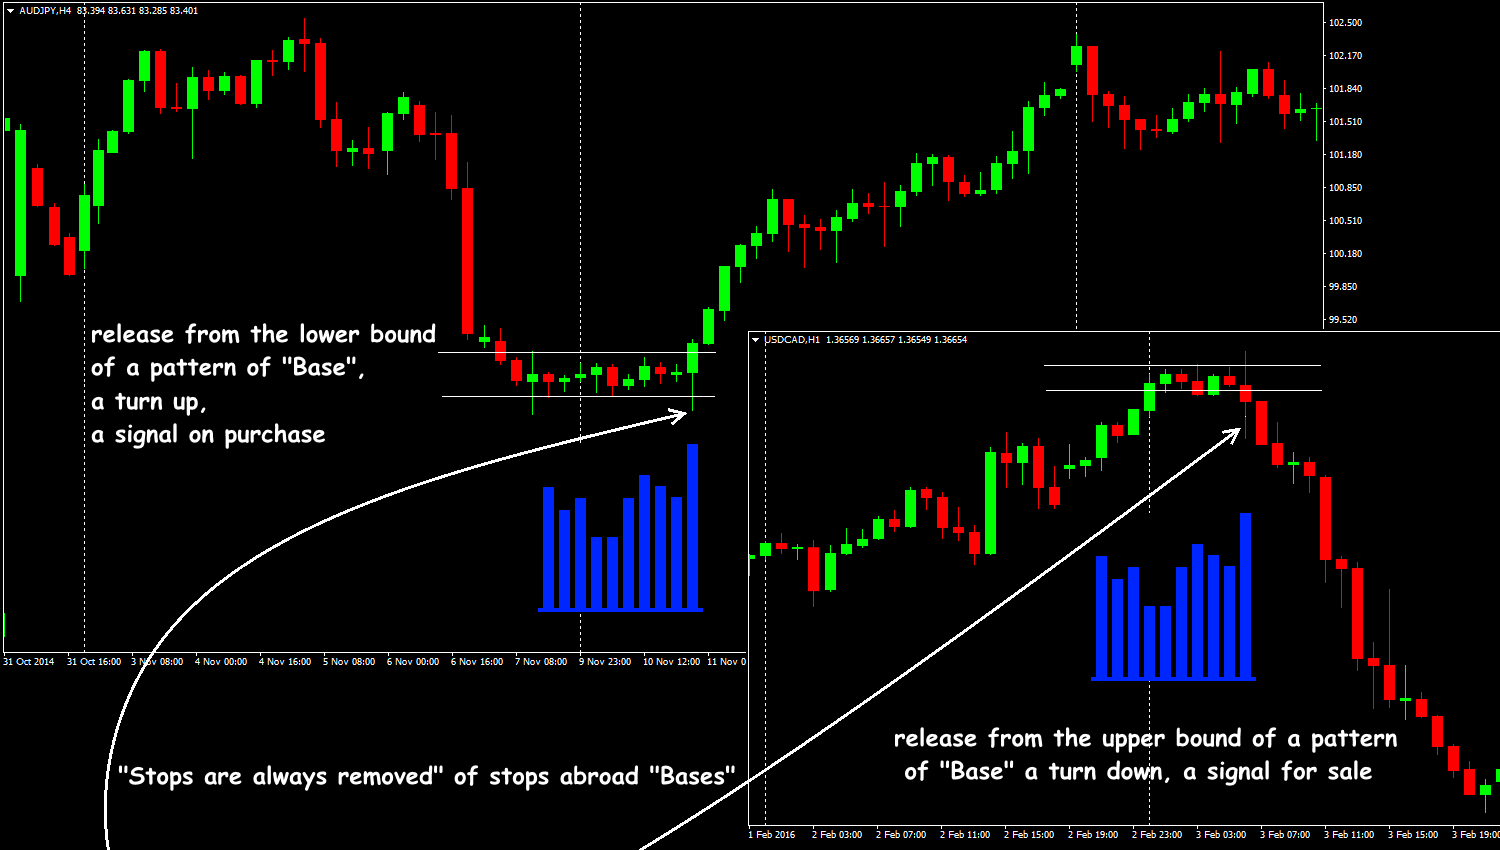
«Base» Forex pattern is fulfilled according to two standard schemes – on a border breakthrough/kickback.
- On a kickback: «small» bars are accumulated near price border (without a breakthrough) and the trend (with a high probability) will be developed.
- On breakthrough: the localization zone (consist of bars of approximately identical size and a look) appears after «puncture» of the key level and thus the signal on continuation is formed.
From the point of view of the market, before an exit from «Base» channel «Stops are always removed» from the estimated movement side – do you remember classical councils to put the postponed orders behind borders of a flat? Swings (bars with small «body» and big «shadow») are always appeared before breakthrough to terminate the postponed orders which have «collected» during weak volatility.
If the market is going to go up (that is to break the upper bound of the channel), then it is necessary to cause operation of small BUY orders before it, to push out from the market just those inexperienced players who so like to put StopLoss too close to the opening price. As a result, the candle with a big shadow appears in the channel (in this case – down) before the true breakthrough, and it is already possible to enter on its correction, and we put StopLoss slightly below than such «tail».
It is not so unambiguous situation with the estimated movement down − stops are removed not always before falling, because the trading psychology works – the market always falls much easier and quicker than grows. We will open a position down when the price falls, at least, to the «Base» width (1,5 width better). In that case more difficult to determine the StopLoss level – it is recommended 5-10 points above the «Base» lower bound.
If the «Base» is formed not in a zone of the significant price level, it can give a stable signal on an entrance to the market too, but weaker. Then we recommend to put the first TakeProfit level at the next key level, and StopLoss – similarly.
Cunning, predatory, turning
«Dragon» Forex pattern
The idea of a pattern has arisen from a Price Action technique which estimates all graphic figures, first of all, from the point of view of trade volumes and requires accurate proportions between key points. The model which has received the name «Dragon» (Dragon Pattern) is an option of a standard «Double Bottom» with certain internal parameters and target reference points. The inverted option of «Dragon» is fulfilled as «Double Top». As well as standard double figures, a «Dragon» pattern is based on usual rules of turning points that allows opening a position at the very beginning of a new price trend.
We will consider a basic pattern «Dragon» structure:
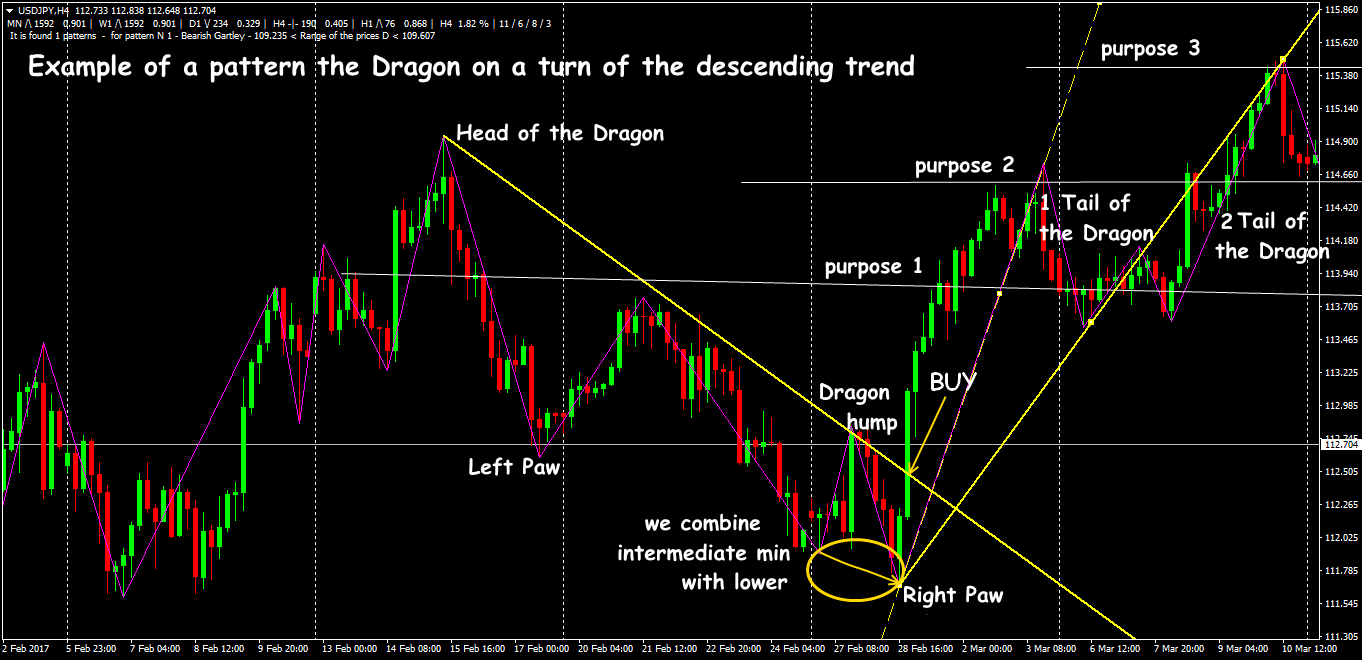
Point A: «The head of a dragon», the main site of the model, defines the main target points.
Point B: «The left paw of the Dragon» or first cavity
Point C: «The Dragon hump» (has to be in limits (0.38-0.5) from length of the site of AB)
Point D: «The right paw of the Dragon» (within (0.618-1.27) from length of the site of AB)
Point E: the moment of the breakthrough of the model trend line – a signal for purchase opening.
The main site of any «Dragon» Forex pattern is the first one − «Head», further, there are the « Left paw» and the «Right paw» price difference between which has to be no more than 10%.
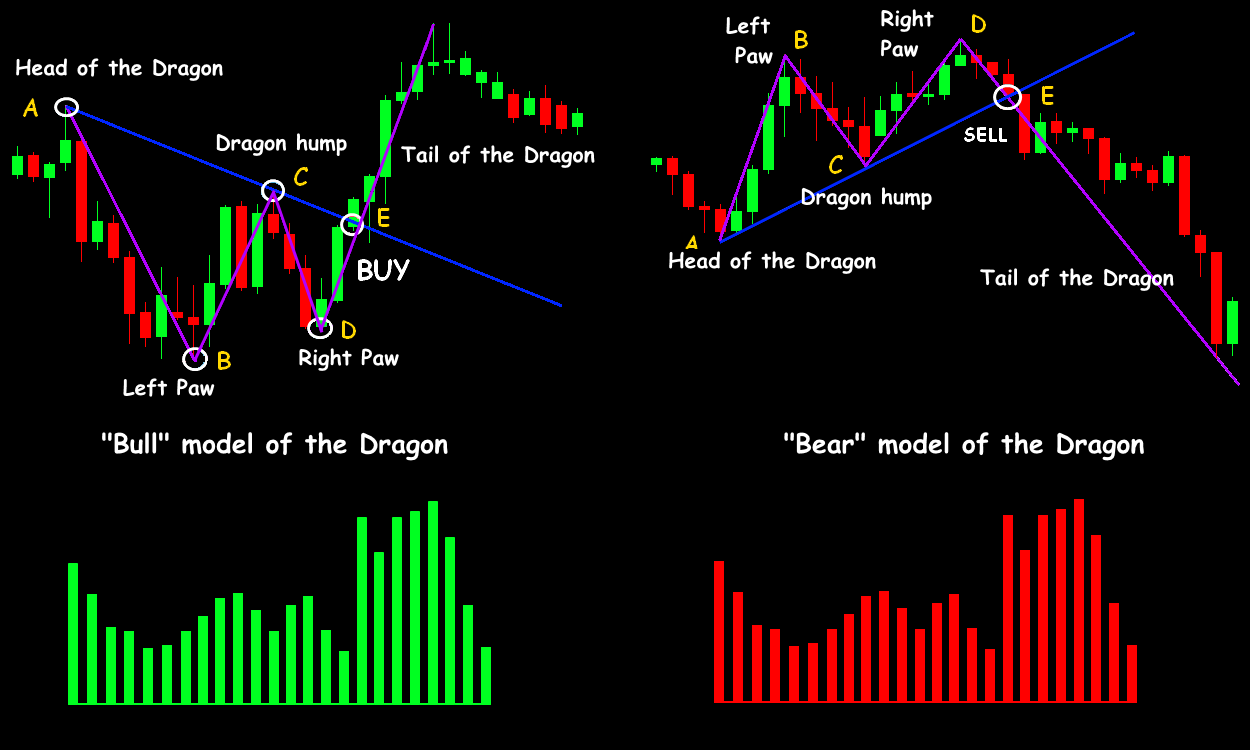
The pattern center is the point of the first kickback – a «Hump» point through which a basic trend line is drawn. It is a local extremum of the correctional movement, and the three first points just create a standard «Double bottom» Forex pattern. Practice shows that the «Hump» point is placed between the levels 38% and 50% of a Fibonacci`s grid: from the «Head» to one of «Paws» − the lowest for basic, or to the highest – for the inverted pattern.
In particular second «limb» has to rely on key pivot-level. The turn signal has to appear on the «Right paw» – we look for confirmation on any oscillator (standard MACD, RSI or Stochastic will be enough), it can be turning bar or divergence. There surely has to be the growth of trade volumes before the turning moment. The breakthrough and closing of a candle behind the trend line «Head»-«Hump» is necessary for an entry point.
The main model turns towards growth, that is it gives a signal on the purchase, the return forms the descending trend and suggests to open transaction for sale.
- The first target point for partial closing of profit is at distance 1.27*CD.
- The second target point – in the range (0.886 − 1.0) from BC piece length.
- The third purpose – at distance of 1.38 AB or until the return moment.
Distance from the position opening point to the third purpose is called «Tail of the Dragon» − its length in points shows a potential profit of the transaction. The first StopLoss is placed 5-10 points below than the lowest minimum of two «Paws of the Dragon», in case of achievement of the profit first level we transfer stop in the black, and further, we move it according to the usual principles of a money management.
The «Dragon» Forex pattern analysis and trade on its signals should be continued only if the model internal trend line is well visible. «Dragons» are appeared on all trade assets, including stocks, but, as well as the majority of graphic models, they are considered as steady only on the periods from H1 above and stable volatility. We don't trade «Dragon» on news!
The sharp and steady trend turn occurs extremely seldom − as a rule, several extrema in the small range appear. The «Dragon» pattern is formed much more often than «Double bottoms» and «Double top» similar to it, and, therefore, it is possible to use it both in long-term, and short-term trade.
And as the conclusion …
The Forex graphic and candle patterns subject is inexhaustible, but at the same time is rather subjective. As well as in art, each trader sees something special on the price schedule and, as a rule, estimates the reliability of that by some personal criteria. In search of profitable models with obvious points of an entrance and exit the trader almost doesn't pay attention to global things (trend, key supports/resistance, volumes, base and so on) and as a result – makes a mistake. The majority of classical patterns work at the modern market not as it is stated in works of classics, therefore, it is important to find urgent tactical situations and constantly to verify the obtained knowledge with the current market situation.
Social button for Joomla