

")
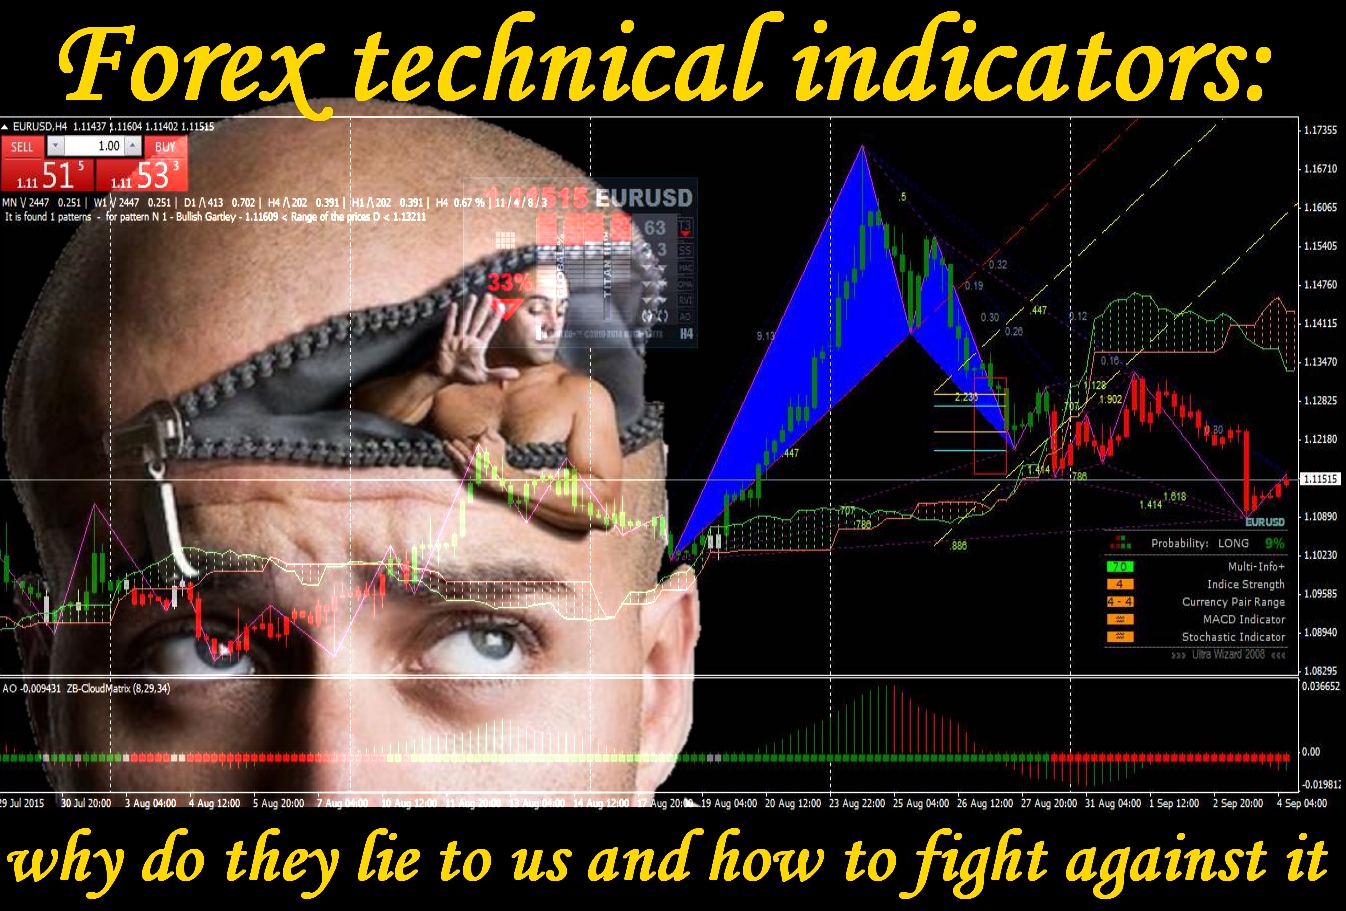 Thanks to informational technologies classical technical analysis became available to each trader today, actively advertised and develops, but at the same time increasingly works against small player. Why all Forex technical indicators in varying degree lies, whether it is worth using them in the modern market and how to reduce possible losses?
It`s meant that all analysis tools shall raise estimate accurateness of the possible price behavior, facilitating thereby adoption of trade decisions. In the financial market any method doesn't guarantee profitable result, but can give temporary statistic advantage to the trader, that will allow him to earn steadily more, than to lose.
here is no sense today to call in question use of Forex technical indicators – all participants work with them and allow to profit even from the senseless (from the point of view of the base) market, which is difficult (and sometimes – already late!) to analyze in detail.
Actually the majority of indicators don't lie (well, or almost!), a question only what do you wait for from this information. Most of traders mistakenly considers technical methods a guarantee of estimate. However much we wanted to the price went behind a settlement signal (and not vice versa!), any Forex technical indicator doesn't influence future movement of the price at all. It is intended only for estimation of a current status on the basis of the analysis of history, and not for a prediction of future market situation at all, and always shows to you only what a developer of the indicator wants to see.
Calculation of the technical indicator: admissible mistakes as compromise
Let's settle directly what means «indicators work». Three options of estimation are offered: indicator
• … carries out calculation for the set algorithm;
• … shows potential point of entry;
• … predicts future.
Practically all indicators are comply with the first group of requirements, the second – the most exact, the third group – exotic like predictive indicators – we putting it aside.
The Forex technical indicator (or the market indicator, or the indicator of a technical analysis, or technical market indicator) – the mathematical algorithm processing market information (the price, amount, time) which result of accomplishment shall be information on the current parameters and a tendency of movement. Data can have digital, graphical or other form on the basis of which analysis traders (or ATS) open transactions.
The main idea is based on the assumption that a calculation algorithm is correct with sufficient probability of success. At the same time it`s also supposed that the trader, having received an analysis result, correctly understands it.
Each settlement process to some extent «loses» or modifies information from a price flow, and such loss in the course of transformation reduces the accuracy of results. The indicator is more difficult, the more assumptions, roundings and averagings are applied, and, respectively, causes less trust to results. Remember the Money Flow Index indicator which in general operates with own artificial concept of «the typical price»! Calculation of the indicator shall be simple and clear, otherwise what sense receive the result more and more far from reality?
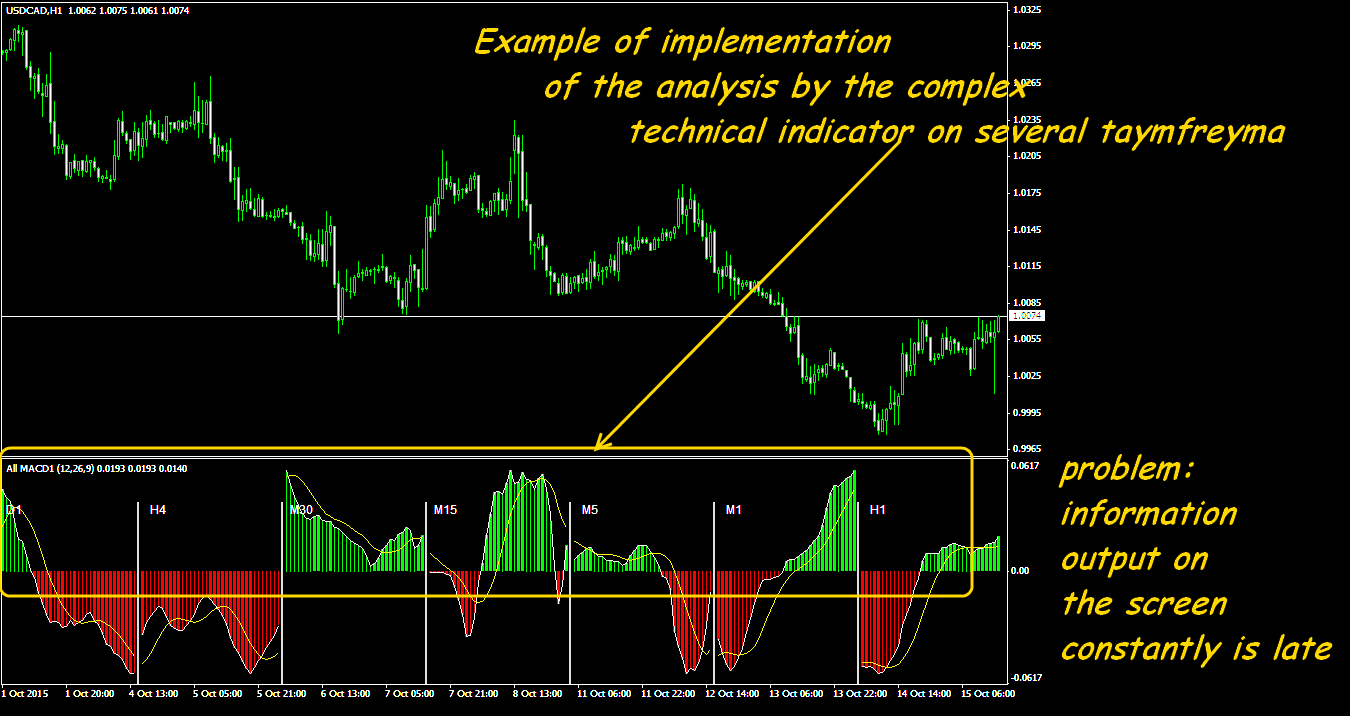
And the first compromise of such processing can be considered cutting of a price flow on time frames (installation of a timeframe for display of the schedule) – each candle will visually show to the trader only 4 basic prices for the period (open, close, high, low). Therefore the price chart by itself is already the indicator of market information. From here benefit of the simultaneous analysis on several timeframes is directly visible – such indicator with identical calculation always specifies a resulting effect.
The indicator doesn't make trade decisions, if only doesn't send the settlement signal to the trade robot for opening of the transaction. More or less precisely «traditional» technical indicators in the terminal Forex work at long scales, and on the short periods create to retail traders a set of problems – percent of admissible mistakes on small timeframes exceeds critical value.
Problem of obviousness of result
The main benefit of technical trading – psychological: it gives to each player some feeling of an order and predictability of the market. Small players traditionally prefer a technical analysis (ignoring fundamental) and run together behind indications of standard indicators which practically all treat equally. As a result the «global» analysis such «the self-realizing prophecies» are created: if on indicators the signal«to purchase» is visible, then buy all and, naturally, the price begins to grow! To some limit, certainly, then the large player joins who always takes the lead, and therefore obvious technical levels constantly give profit to stops hunters.
Even if you trust your indicators, then it will be necessary to work very carefully in technically «obvious» price levels or key points of graphical figures – movement of the price near them without fail contain dealer manipulations.
For example, if there is information (or you only assume its availability!), that at some price level there is a large option barrier, than just technical indicator will prompt, how actively this level is protected by the market. As a rule, there are sites of a fast flat, when approaching to level there are sales and right there – fast kickback on 10-30 points – such series repeats until closing of the option. Well tuned oscillator quite can warn such situation. If you can`t pick up Forex technical indicator with the sufficient advancing effect – count these situations logically independently.
Problem of the large player
Sources for the fundamental analysis are enough today: news, press, analytics, mailings and other. Except direct access to the insider, there are technologies allowing to get even regular news for only a few milliseconds, but it`s the right of big money.
In stock trading the main indicator is information on the demand and offer, distribution of a currency basket and the hedging transactions. For example, if the participant of the market – a bank, then in case of requirement, say, in euro it buys it irrespective of indications some stochastics and until receives the amount, necessary for itself.
Large players knows which technical «indicator» signals will be issued in large quantities by trade systems of ordinary traders, therefore in advance expose line items slightly above/below than key levels. Plan on the fact that the mass identical thinking will cause a chain of execution of orders in this direction, helps them to earn with little effort, just on inertia of crowd.
It`s always been the case and will be always, this is the market law. How to fight against it? By information, mathematics, logic and practical experience.
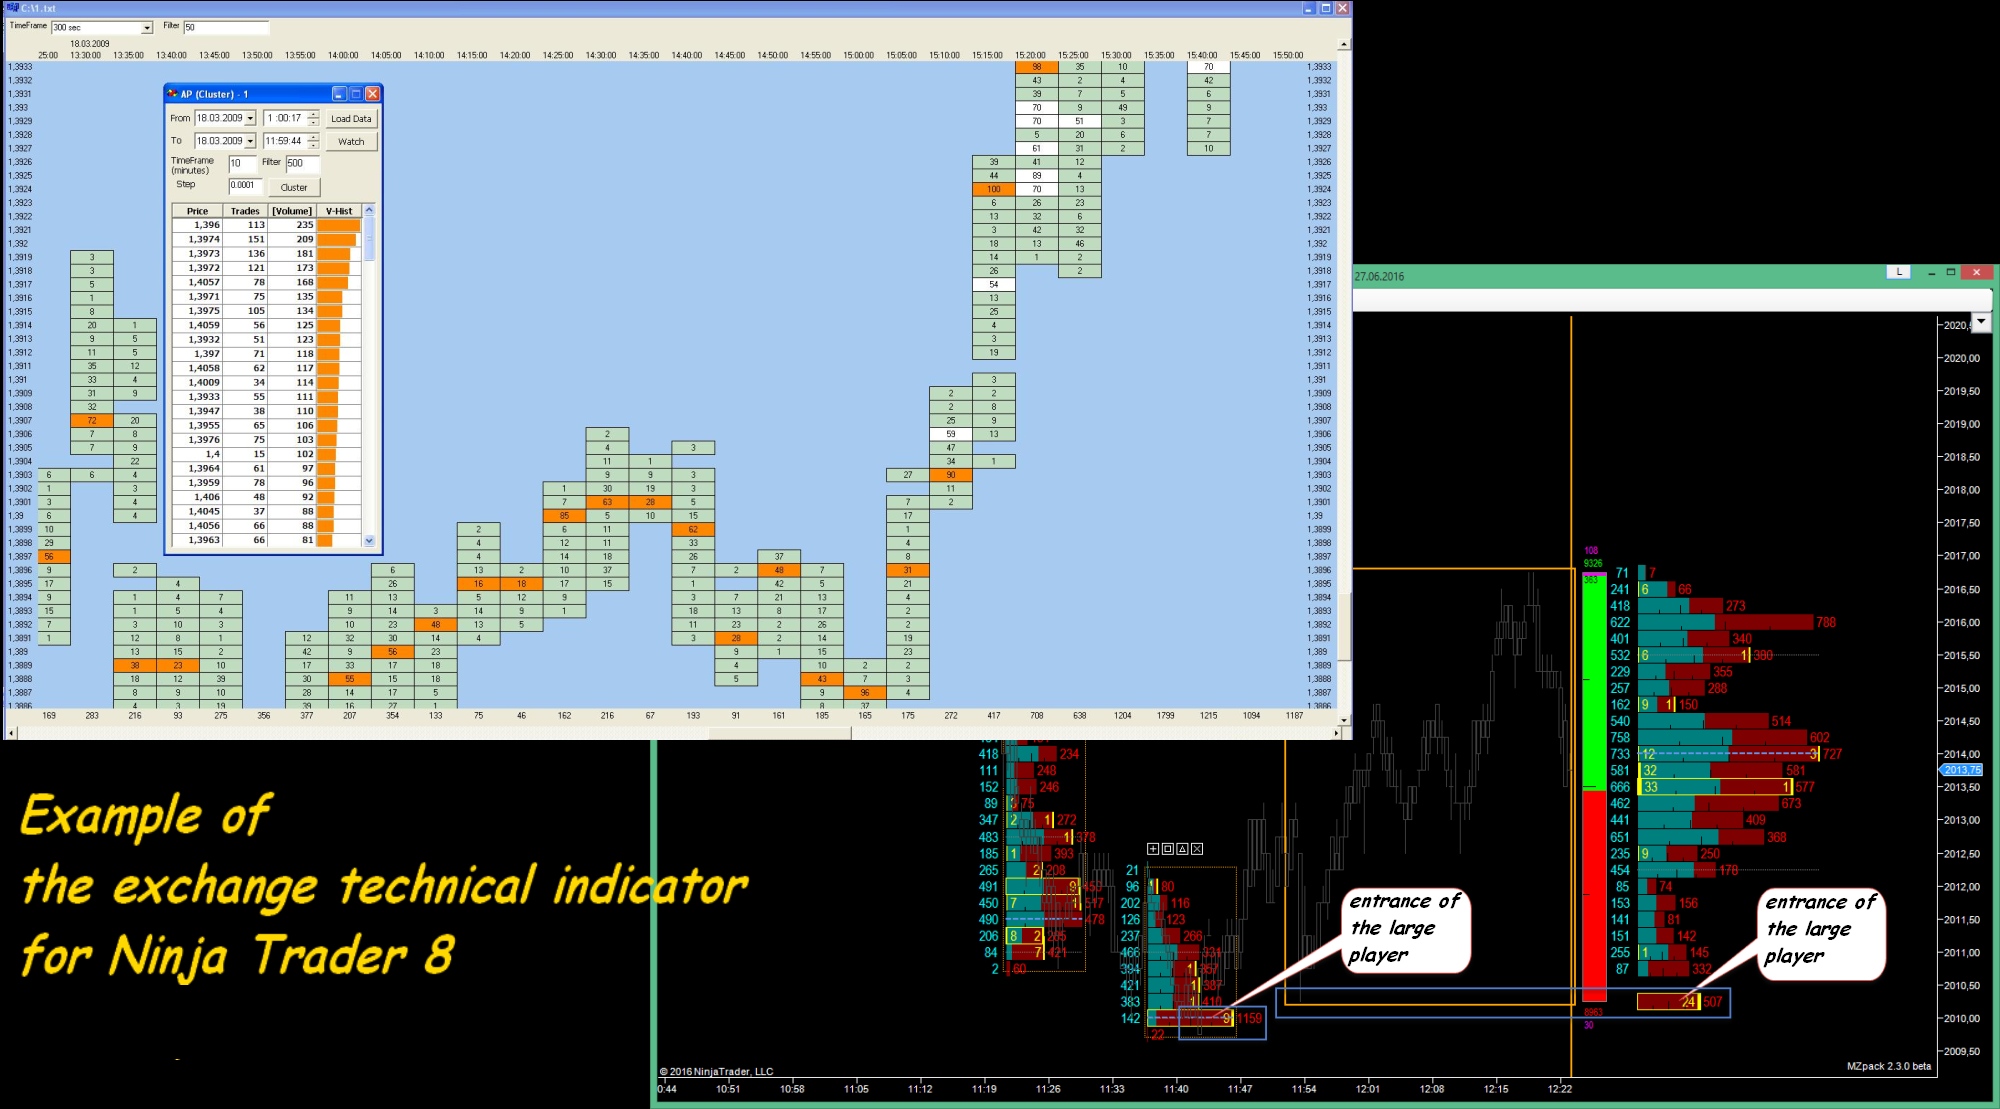
It`s clear, that large players work not in MT4(5), but in exchange terminals, and use the indicators, processing real exchange (but not tick, as on Forex!) volumes. For example, such as VWAP (Volume-Weighted Average Price) or TWAP (Time Weighted Average Price), which require a continuing flow of exchange data (the contract price, transaction amount, transaction type). The trade value of signals of such indicators is much higher, but even if there is an access to an exchange flow, it is possible to directly apply such signals only on futures, but not on a spot assets in any way. But access to such information is extremely important for overall estimation of the market and holding a position on Forex. For a possibility of receipt of such information it makes a sense to pay or hold on the exchange platform the small real account for shareware access. Such costs quickly pay off by several successful transactions.
Basic conditions of Forex technical indicators
The technical indicator – regular mathematical process, on which entrance primary data about the price and amount at a given time, and at exit – the same market price of an asset or a certain dimensionless parameter, in this or that view, convenient for perception by the trader.
Task of the technical analysis – estimation of future market behavior on the basis of last condition taking into account, that people psychologically in similar situations will proceed equally. The trust to a technical analysis corresponds to three modern concepts of market efficiency:
- The first group of participants is sure that ALL information is reflected in the price (strong trust) and fundamental events don't influence it. It turns out that the one who makes the technical analysis more qualitatively is more successful.
- The second group considers that in market price only readily available information is reflected (relative trust) and it`s necessary to consider the base. That is, even carrying out a technical analysis, the one who has continuous access to insider information wins.
- The third group considers that current price doesn't reflect a real asset cost at all, and shows only result of worldwide financial policy. It`s meant for success it is necessary to have only the large equity and to influence actively a fundamental background.
Most of us concerns to the second group, and therefore choosing the indicators, first of all, it`s worth paying attention to settings. Look for options at which, except the traditional number of bars, at any type there are following mechanisms of «correction» of calculation:
choice:
- a price type for calculation (open, close, high, low, and also average or other options);
- different methods of creation (straight or dynamic sections);
- price type parameters (for example, breakthrough of High/Low of the current bar and/or breakthrough on closing price of the last created);
and also setting:
- shift of calculation for time for a quantity of bars;
- space level (in points) from limits of the channel, for which exit will be considered as breakthrough (or a turn);
- filter level (to cut off insignificant signals);
- support/resistance trailing level;
- minimum width of the channel (in points) for elimination of «noise» (that is if the settlement new limit defends from previous less, than on this parameter, then it is ignored and isn't «drawn»).
Today practically all popular indicators have an open program code and if there are no such parameters in basic settings, than it make sense to modify them under your tasks.
Some words about the trendwatching Forex technical indicators
Any indicator processes only last data. From this point of view the regular trend line is much more reliable than other creations because graphical supports calculation, where you can wait for the price in the nearest future. The first place, and by results, and by availability, among trend indicators well-known «moving» firmly hold. The known opinion of George Lucas that is earned on moving averages real money more, than on all other indicators, concerns only to those traders who are able to use these «movings» correctly. That is careful adaptation of classics to your personal requirements is necessary too.
Yes, «moving» are late and, points of their mutual crossing say that to enter already late, but the more old timeframe than the analysis, the less you suffer from this effect, and the more period of calculation and more successfully picked up shift parameter for bars, the more precisely the current result reflects the strongest tendency. As the example – checked for years (and money!) Ishimoku is constructed on regular moving averages. If you want a benefit in an entrance – try to pick up non-standard options as a moving.
Trading on a trend, it is necessary to understand that technical corrections occupy from 30 to 70% of the current trend, and therefore it is possible to use corrections and it is necessary. Correction in 50% (and most often between 38% and 62% of Fibo) – the most widespread. The market always grows more willingly, than falls, therefore in case of the steady ascending trend the current correction usually doesn't exceed 30-35%, and on the strong descending – 50%.
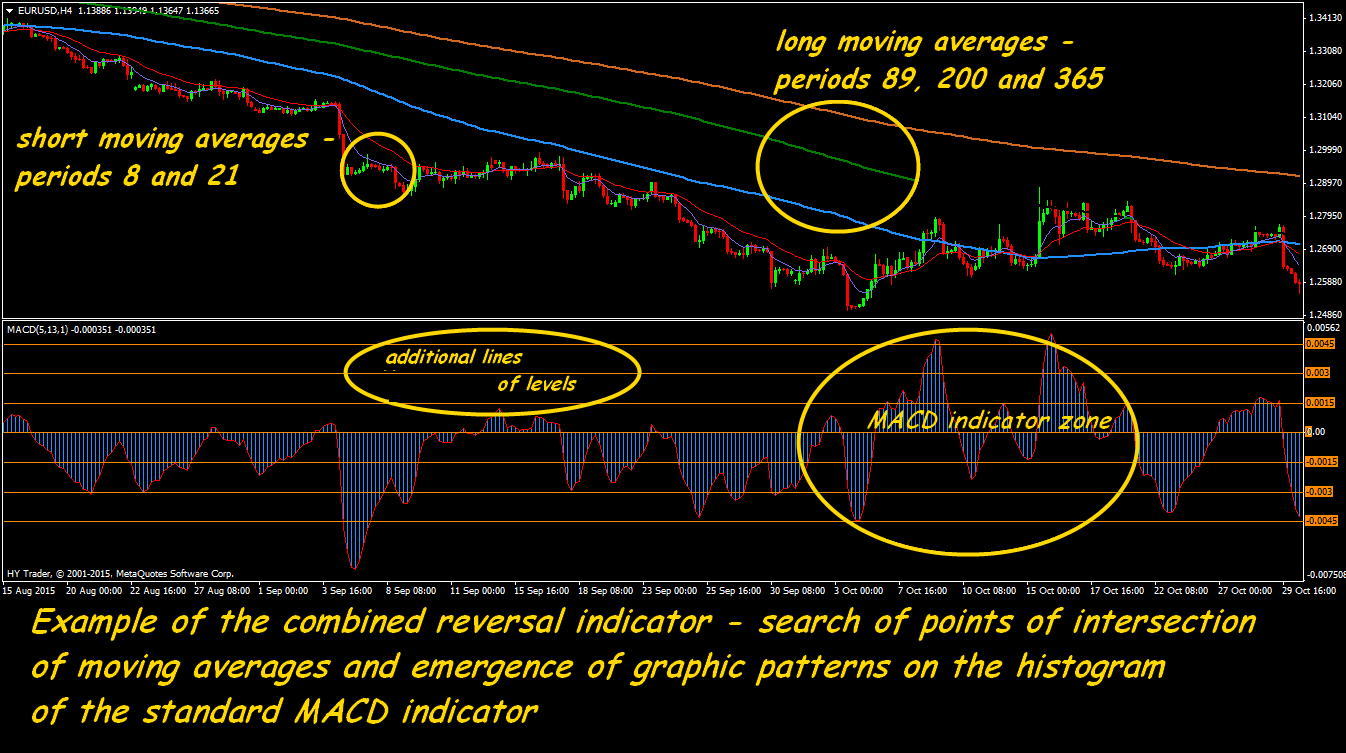
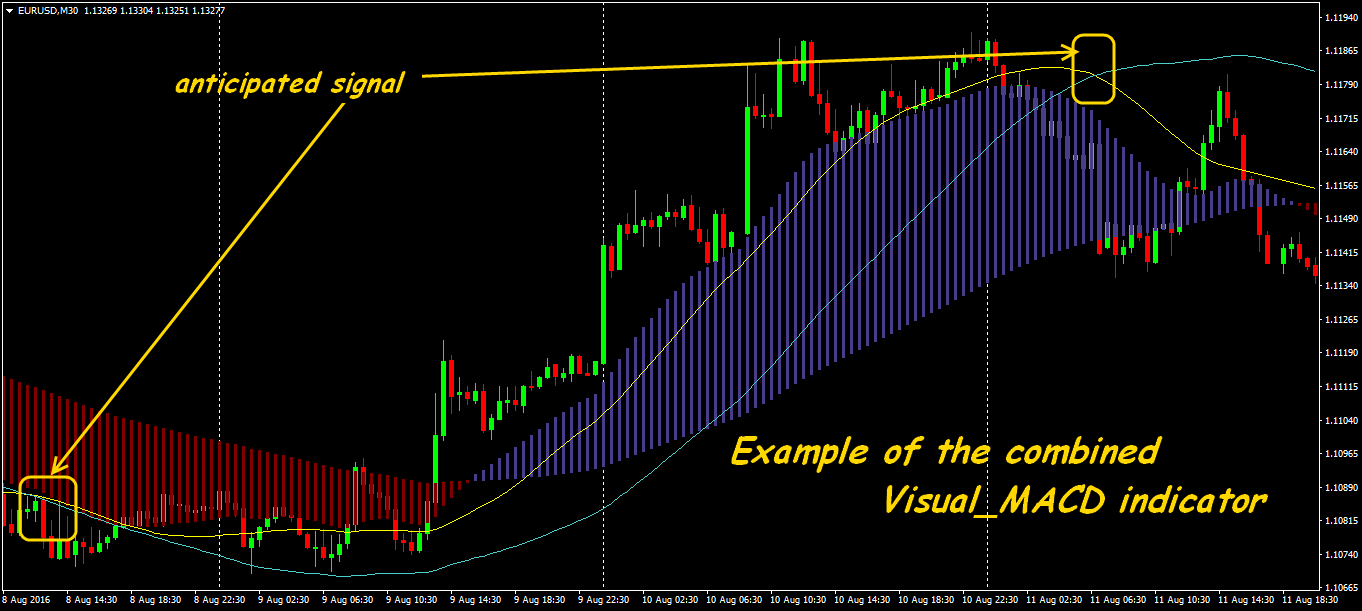
Don't forget – standard methods of the trend analysis are available to all, therefore hybrid options remain the most profitable indicators of a turn, for example, MACD + the graphical analysis.
Some words about oscillators
Oscillators estimates situations of the overstated purchase/sale. And though modern analysts call in question a concept of zones overbuyness/oversoldness by itself, rather, the reasons of their emergence, but classics really works on them. Long stay of oscillators in zones OB/OS signal about critical amounts in a certain direction and help to close line items in time or to turn. In complex trade systems oscillators specially are selected with more short-term method of calculation to compensate inertness of trend indicators.
Don't expect oscillators on short timeframes! A set of false signals of indicators create illusion of a fast successful entrance at the trader and distract from the real analysis of a situation, why most of participants of the market buy or sells at present.
Just on the periods above M30-H1 the strongest signals of the oscillator – divergence appear. Due to a combination of viewing of dynamics of the smoothed price and graphic methods, situations of divergence allow to assume a probable reverse long time before the same oscillator shows a signal on an entrance by means of lines crossing.
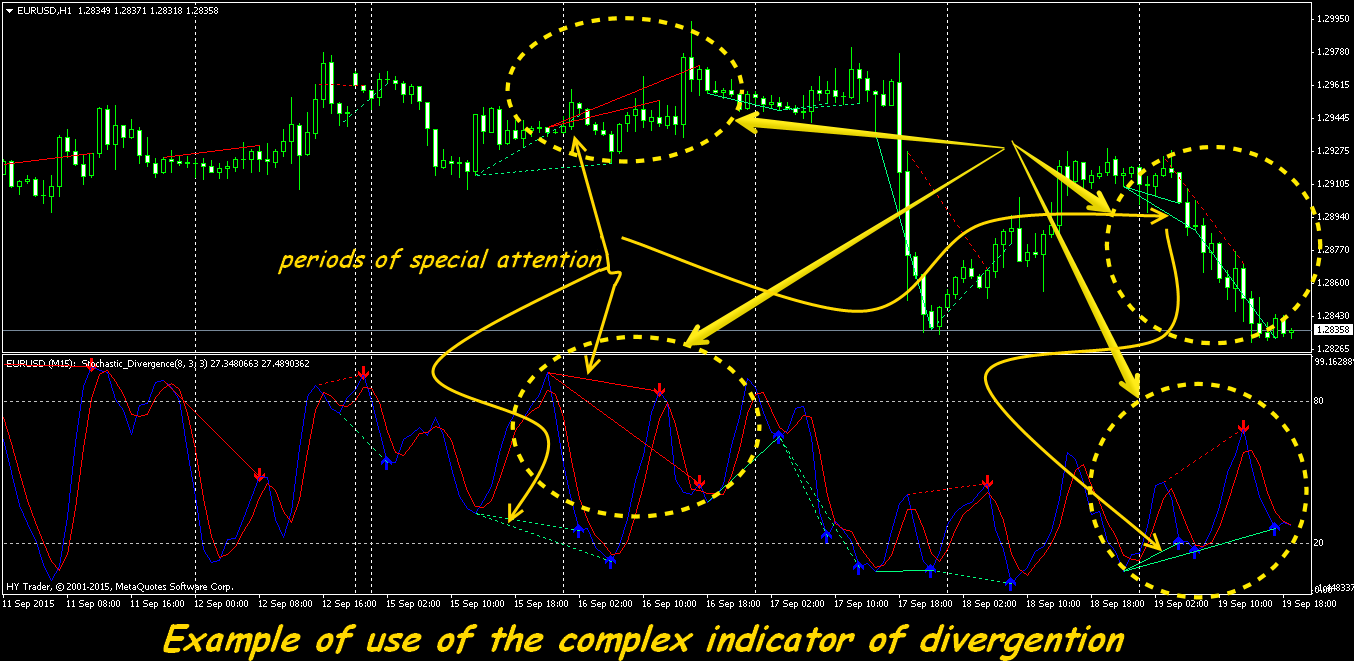
After the corresponding testing it is possible to turn on to TS indicators which show all types of situations of divergence and even a point of a possible entrance. It`s worth paying attention and to other complex options:
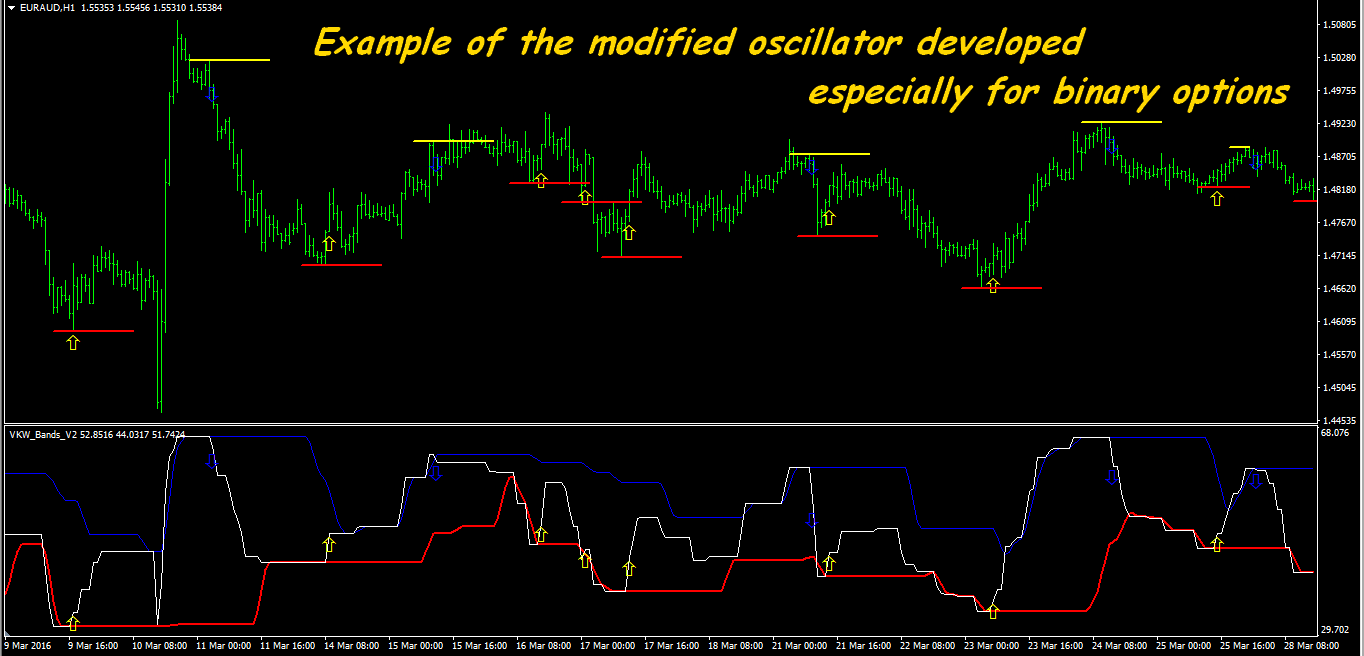
And as if didn't criticize Williams's oscillator, that fact that its various options without fail still included in exchange point-of-sale, says that the majority of such signals can be trusted. We advise those who is afraid of characteristic delay to experiment with parameters of shift and to increase the analysis period. And those who is interested in the adjacent markets can advise to look in network for original versions of the oscillators, developed especially for binary options, where the accuracy of an entrance has special, crucial importance. Such tools are quite applicable on and Forex.
It is considered that the majority of oscillators very strongly are late, but usually they have the mass of settings and by matching necessary it is quite possible to receive high degree of reliability of a signal. Any oscillator should be adjusted carefully under a specific asset, period, strategy, trading session and other conditions – you shouldn't be trusted others experience. And only after successful testing, taking into account the correct management of the capital, of course, if you are able to estimate correctly the current situation taking into account the fundamental analysis, it`s possible to take technical signals of the same Stochastics (either RSI, or the AO) towards the strongest movement and to enter the transaction.
Some words about range indicators
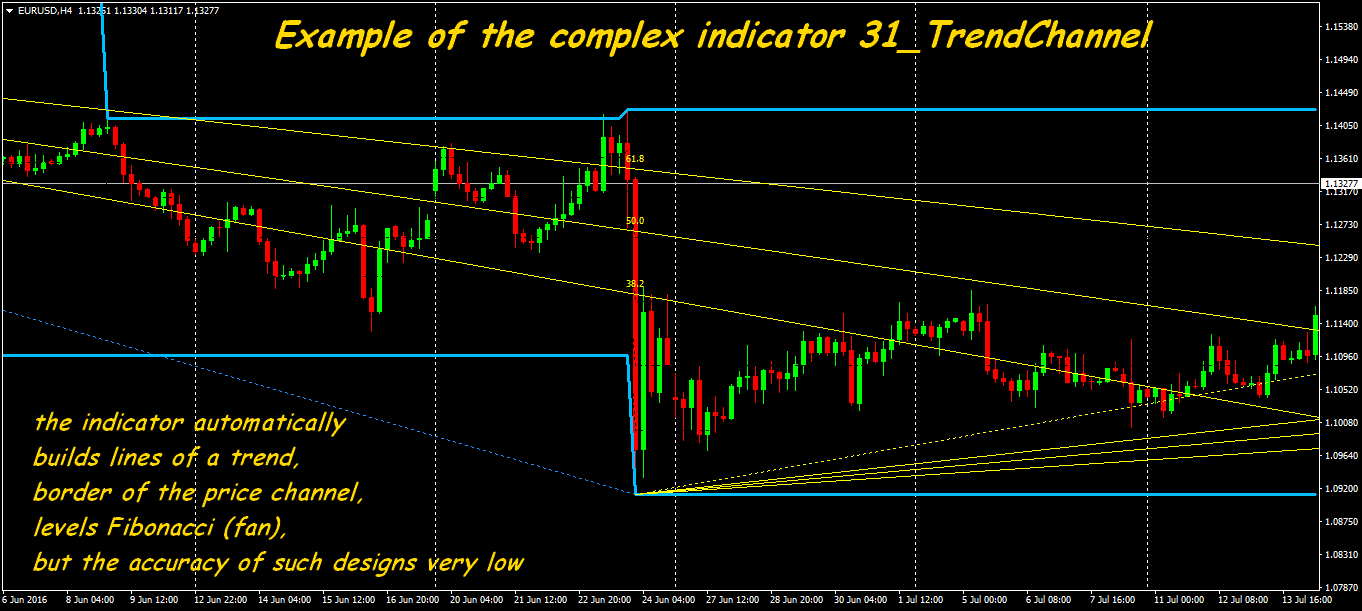
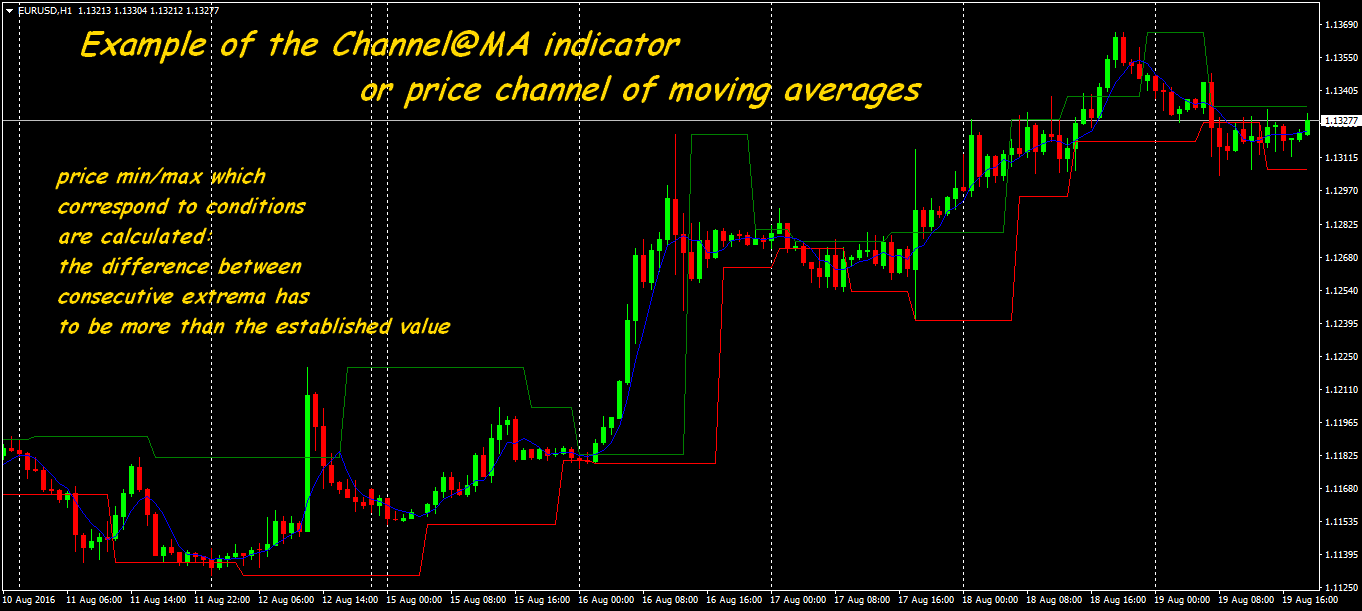
Actually, any long-period MA already determines limit of the price range, which breakthrough already a reason for additional attention of the trader. Correctly built channels can be used in case of fix and trailing of stops, determination of a trend or reverse. In the network you can meet experiments of creation of the price range, some options can be rather profitable, such as, the channel of moving averages:
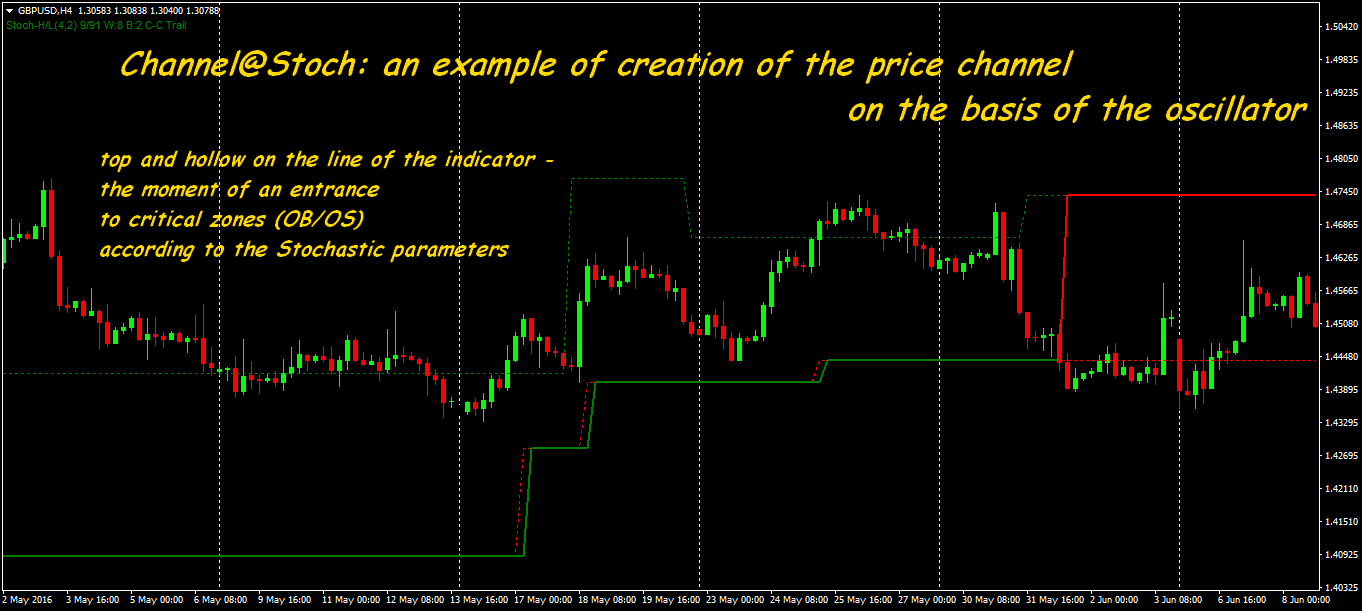
Options of inclusion of the oscillator mechanism in trend calculation are interesting, for example, a stochastic:
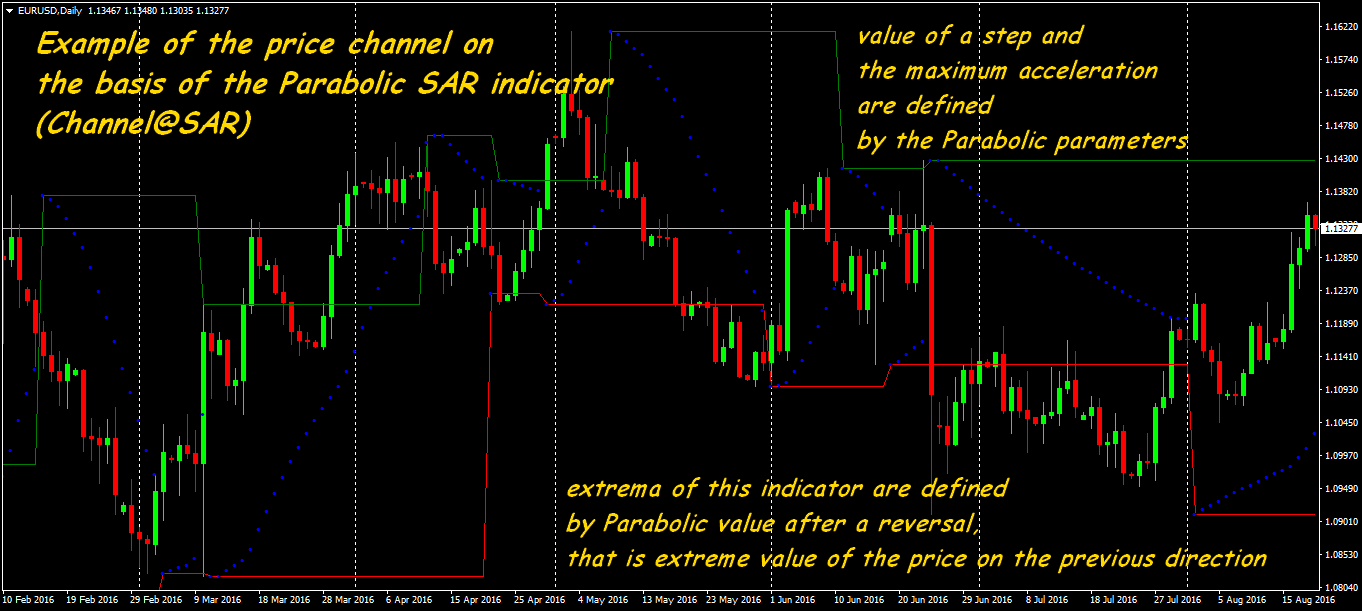
Experiments with classical trend indicators give reasonably accurate dynamic limits of the range, for example, ParabolicSAR:
In case of creation of the price ranges it`s worth applying non-standard way – it can give you a trading signal slightly earlier. Generally indicators of the range can build the lines of support/resistance (lower/upper limits), not on clean price, and on any its transformed value, the main thing that it was the extremum, determined in one way or another. A problem of such Forex technical indicators can be only a delay of a visual output and incorrect reaction to speculative throws.
Indicators of volatility – are obligatory!
Without correct estimation of volatility there can't be a full trade strategy. The complex trade systems offered today unfairly forget about the DMI indicator (Directional Movement Index) it is used for estimation of a vector and force of a trend. As well as the majority of indicators, DMI was created for the stock market, but it is effective for all assets.
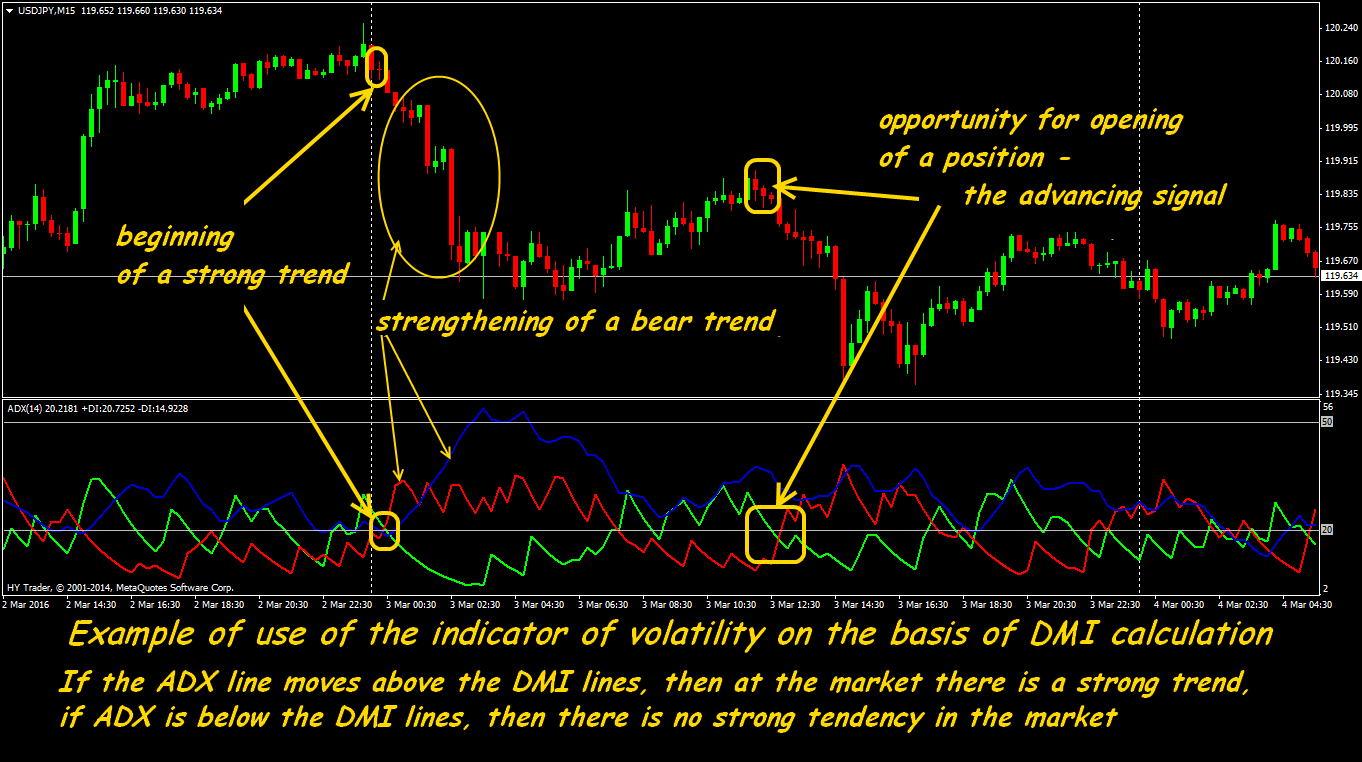
Thanks for the analysis of alignment of forces bulls/bears, DMI allows to reduce origin of a strong trend at an early stage. As well as all indicators of force of a trend, DMI is most effective in case of long-term trade. Calculation of the indicator uses max/min of the previous bar, and a vector of the current trend is determining by classics: in case of the growing/decreasing trend each of new extrema shall be higher/lower than previous.
As a result the indicator builds the dynamic line, reflecting only that price range, which goes beyond an extremum, in addition averaged and smoothed EMA. Delay, of course, completely can't be eliminated, but set of DMI (-) and DMI (+) gives the dynamic range, which is narrowed in the period of a flat and extending with growth of volatility, and as a part of the popular ADX indicator precisely shows balance points sellers/buyers.
Some words about time
Certainly, the analysis in case of determination of point of entry is surely carried out on several periods. But practice shows that switching to the smaller period on deduction of already open transaction it`s worth if you have sure (and better – partially fixed) profit. For example, if the entrance was executed on M15 counting upon 3-5 subsequent candles, but, nevertheless, movement, positive for you, continues – we fix profit partially and we carry out the further analysis on a longer timeframe, in search of confirmations of a possible additional profit.
What intricate Forex technical indicators you wouldn't use, in 90% of cases the mistake on an entrance gives a loss at the exit. If the transaction on the working period goes at a loss longer than your «settlement» time, you shouldn't look for salvations in the form of signals on a bigger timeframe. Perhaps, to close the transaction still early, but it`s worth taking measures for restriction of a loss already now. It`s recommended to leave the transaction on the same period on which entered.
And as the conclusion …
Even considering that practically all Forex technical indicators correctly make the analysis of data, each trader eventually understands that the abundance of various information doesn't give benefit guarantees in the real transaction. Only the most widespread indicators are built in popular trade platforms, but for any terminal there are methods to develop own any complexity applications. As a last resort, it`s possible to write independently any indicator as the stand-alone application or the independent program of a technical analysis together with the point-of-sale terminal.
Forex technical indicators predict nothing, but considerably facilitate and accelerate process of the analysis and adoption of trade decisions. In general, the simpler your technical model of trade, the less it distracts the trader from key movements of the price, the more it useful and more important. And does not matter what method is used by – automatic, semi-mechanical or manual – the main thing that settlement process had high probability of the correct hit.
Social button for Joomla