

")
Today Forex technical analysis just like the traffic regulations: everyone study, some of them - remember, and very few correctly apply. Let's try to understand whether really technical analysis is a guarantee of reliable earnings or they slightly increase chances of success. And is it possible to catch this chance.
The cause of conflict between fundamental analysis and technical analysisconsists in the wrong formulation of the question. Fundamental information tries to answer the question «what will be in the market in the nearest future?», and the Forex technical analysis – «what occurs in the market at present?». Technical analysisdoesn't give the answer to a question why the price moves that way − he takes into consideration only the change in price fact in a certain direction. As a result the fundamental analysis shall formulate options of further events while the Forex technical analysis − to estimate their probability. The conclusions received based on two different methods of the analysis can significantly disperse.
The technical analysis of Forex allows to predict the movements of exchange rates on the basis of a research of data on last courses and volumes of trading. This type of the analysis relies upon drawing up schedules and formulas for tracking of tendencies of the movement of courses, recognitions of good opportunities for sale or purchase of a certain currency at the movement of the market. The analysis of temporary series of prices and their schedules — «charts» is its cornerstone.
The Forex technical analysis is based on confidence that the market has considered everything: both the taken place events, and expectations of participants of the market. Generally technical analysis comes down to a research of schedules (charts) of the former movement of the currency prices to predict their possible further movement.
Information sources for the analysis
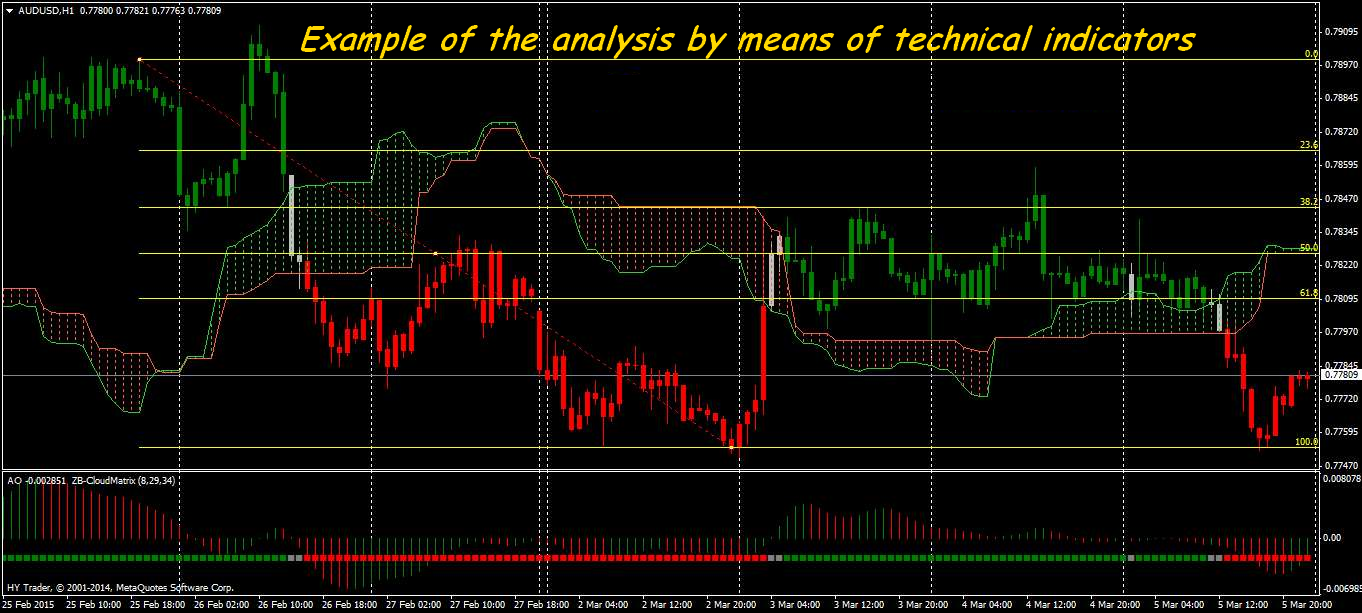
In modern concepts Forex technical analysis is the process of studying of price story with estimation of probability of the subsequent movement of the price. At any moment the market has the actual price information (Open, Close, High, Low), amount (volume) and open interest, but the main indicator of the market for technical calculations is the price.
Because of the off-exchange structure the Forex market doesn't contain data on real amount, and information on open interest is available only partially therefore the technical analysis works only with tick volume (the number of perfect transactions for a unit of time).
Each candle (bar) on a price chart is reflection of trade intentions of millions of participants of the market and, respectively, shows the current balance of the demand/offer. Participants of the market «vote» for a certain direction of the market, opening the positions, and in the trade volumes shift balance on new price levels. If most of participants has no consensus, then the market will lie in a flat until the next large amount opens and won't give it acceleration.
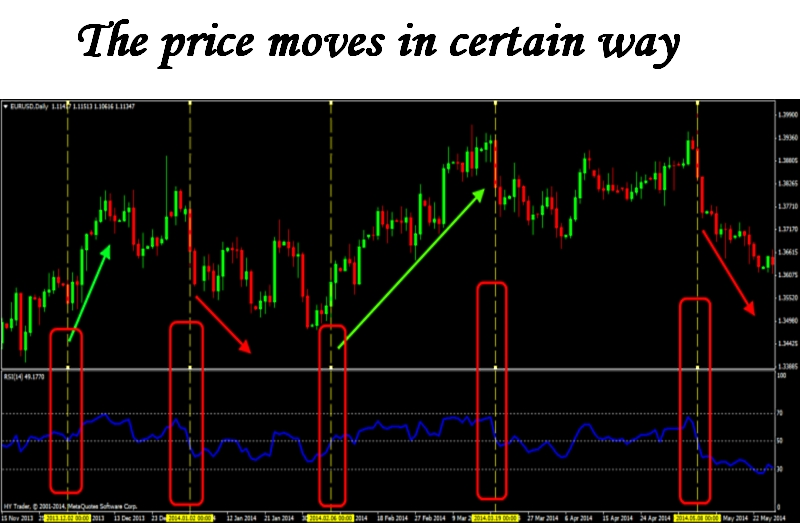
The Forex technical analysis doesn't consider the reason of why the price changes the direction, and considers only that the price already moves in a certain direction. Income can be gained in any market if truly to distinguish a trend, and then in time to close a trade position.
Dow's theory − main postulates of ageless classics
For the first time the ideas which we call today as Dow's Theory became known at the XX century boundary, but they are still urgent and are a basis of knowledge of the technical analysis for any type of financial assets. However, the modern market develops a estimation technique generally in the direction of the fundamental analysis therefore influence of technical factors obviously weakens. Let's try to estimate, how urgent the basic theoretical principles developed for the stock market in modern conditions.
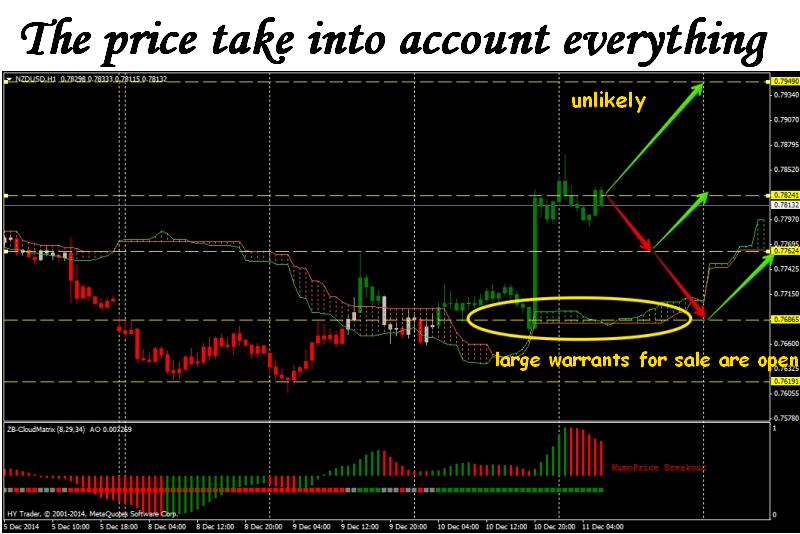
The most important market principle − any influencing information is already absorbed by the market and it was displayed in current price. The technical analyst analyzes a price chart, understanding that, for example, the market grows because the buyers ready to purchase on such rate are already on it, and mathematical calculations of indicators shall show probability of continuation of movement.
All calculations of a technical analysis are constructed subject to the current price includes both the already accomplished facts, and future expectations. The price is the general opinion of the market on this asset at the moment, and its further movement is the amount of all factors including those which aren't visible and aren't studied yet, but they are already influence on dynamics of the price. Even the probability of force-majeure is always considered.
Criticism of the theory:
The most of technical indicators, which are so expected by the technical analysis, are constructed on standard mathematical schemes (extrema, average, frequency, normal distribution and so on), and therefore their indications easily «break» on the unexpected fundamental and just speculative events which are badly giving in to the estimations. Even if such factors don't stop the current tendency, then, at least, generate a set of «false» signals.
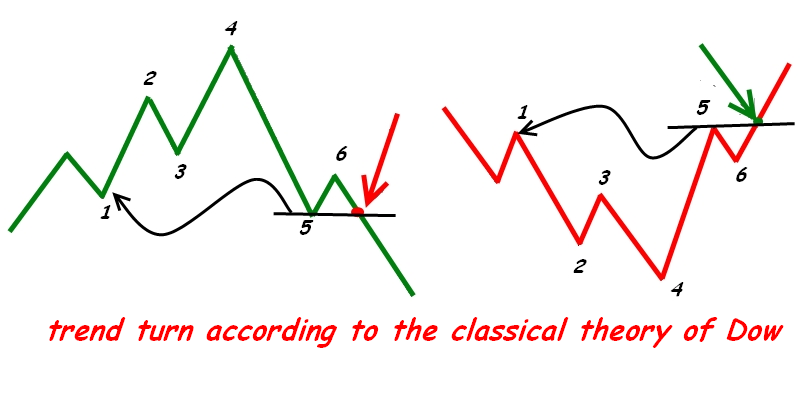
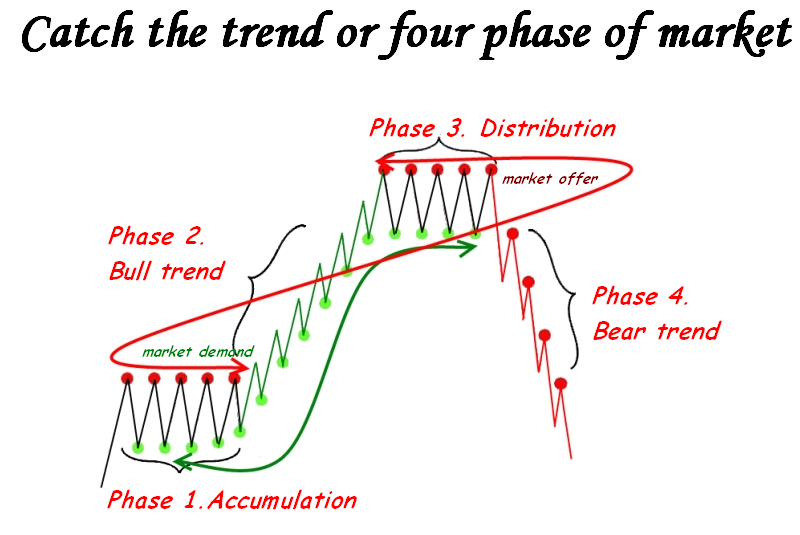
The Forex technical analysis offers to trader a choice of «bull», «bear» or side trend. In addition, according to Dow's theory there are three time types of trends: long-term (primary), intermediate (or secondary) and short-term (small). It is considered that the trend proceeds until, the obvious signal of a turn won't be received, as shown in the scheme below.
Criticism of the theory:
Dow's idea about three temporary trends usually reproach with chronic delay: while according to this theory the steady signal of a turn (breakthrough of level of the previous extremum) will be received, about 20-25% of the current tendency are lost. But you shouldn't forget that this technique was developed for less dynamic stock market and to include the most part of long trends in the trade. For this reason the followers of Forex technical analysis is strongly recommended to trade at least medium-term and long-term tendencies.
What technical indicators wouldn't analyze a trend, according to the theory of balance of the demand/offer, this structure always exists in the market because it has not only a statistical, but also fundamental basis.
Phase 1 «Accumulation» and Phase 3 «Distribution» (flat, base, consolidation)
During these periods the most acute participants begin to buy up (phase 1) or to sell (phase 3) this asset contrary to the general opinion of the market as can be visually shown. There is no strong change in price yet because the number of such players aren't enough.
Technically: it is possible to trade an entrance on a release from rate limit before emergence of an accurate signal of breakthrough.
Phase 2 Growing («bull») and Phase 4 Falling («Bear») Trend
At some point an active part of players, analyzing the market by almost identical technical methods, begin «to see» a new trend and join in the new direction. The trade agiotage begins, the price sharply grows (or falls). Demand is quickly sated and the speed of the price movement gradually decreases.
Technically: purchases on kickbacks to levels of demand or sales open (on kickbacks to offer level.
At some point market makers fix profit and are turned in the new direction. Volumes of current trend leave the market, the price rolls away and the players who were late with an entrance on a trend leave the money to the more successful.
Understanding in what phase the market is now on your working timeframe, it is necessary, first of all, for the choice of the direction of trade (to buy or sell) and only then it is possible to look for price levels for an entrance, that is:
- at the offer levels – we don't buy (or we close purchases): we look for an entrance for sale;
- on demand levels (we don't sell (we close sales) :we look for a point for opening of buy.
The technical price levels which have historically developed (statistically) are always stronger than the current trend therefore you should pay special attention to open transactions near such zones.
For example, if during the ascending trend the price reaches offer level, then we abstain from further purchases, while obvious signal of breakdown occur and the price won't continue growth.
Criticism of the theory:
Practice shows that classical methods of definition of a trend according to Dow are a poor applicable for the Forex market on which the most profitable are the short-term speculative operations based on volatility. The market works in an obvious trend about 30% of market time therefore for stable earnings you should have the effective strategy of work in a flat.
The difficulties of determination of a trend in too volatile market or poorly estimated asset (for example, raw or rigidly adjustable currencies) is the problem of this point.
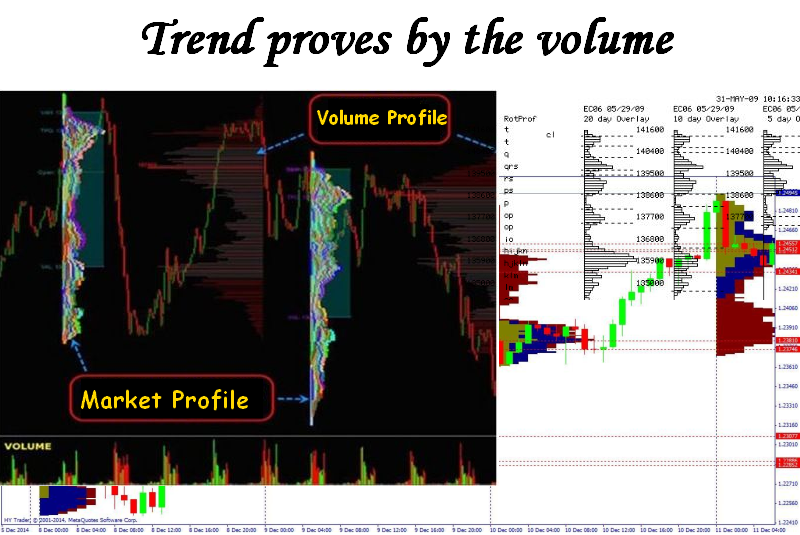
Earlier information on actual volumes was available only to future traders working in «an exchange hole», but today any small, but rather «advanced» trader can see it. Since the times of Dow the importance of the volume analysis isn't called in question as speculative volatility at the small volume can be caused by a set of various reasons which don't have relations to the current trend. If dynamics of the price changes against the background of steadily large trade volumes, then it is already considered «real opinion» of the market, characterizes development of a tendency and gives chance to the small speculator to earn on the main movement together with the large capital.
Tools for assessment of a market profile don't give trade signals on an entrance, but at the same time have practically no «contraindications» and will be useful in any trade strategy. They give understanding who and how controls at present the market where is the level of the fair price and what hides on the market movement.
The lack of this method consists in a huge difference in volumes: the volumes traded on Forex (in hundreds times more than in exchange market), have more high-speed dynamics, and therefore can form other structure of a market profile, than the similar currency future. Besides, a large volume of the hidden volumes is always at the exchange and even the real exchange profile can be not absolutely correct.
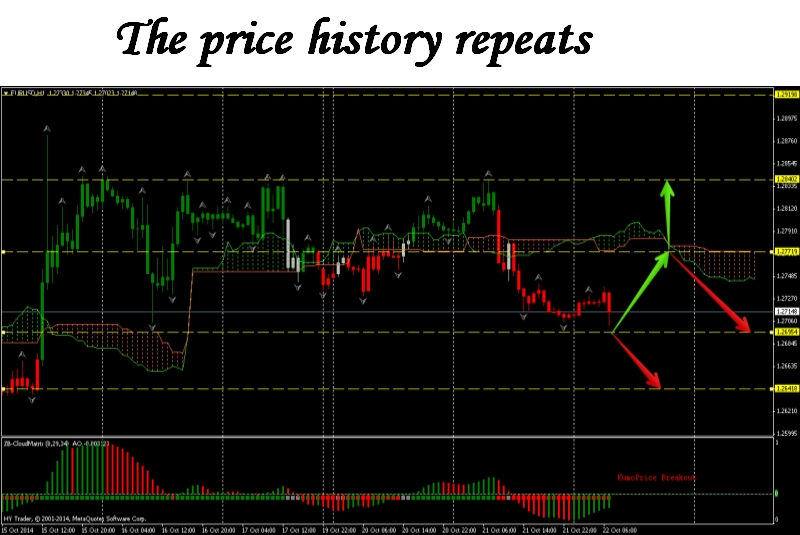
This statement – the main thing in Dow's theory and the only thing which is based not only on the macroeconomic theory of cycles, but also on properties of human psychology. This axiom practically has no mathematical base, but the theory of the Forex technical analysis wouldn't make sense at all without it.
It is meant that psychology as certain person, and the crowd psychology practically doesn't change over time: if in the past under any entry conditions the bulk of players made a certain decision (moved the price to some extent), then in the future under «all equal conditions» the scenario of its dynamics with high degree of probability will be the same.
Criticism of the theory:
Market situations «under all equal conditions» don't exist in reality − there will always be a factor which wasn't present at the previous conditions of the market or wasn't considered.
The market is actively developing and self-training system. Relationship of cause and effect (for example, mutual correlation of assets) can be broken after the non-standard market events (that is quite frequent in the modern market!) and reaction of the market to externally «standard» event can be other.
Main methods of the Forex technical analysis
In the technical analysis there is a set of various tools and methods. All of them are based on one general assumption — by the analysis of temporary series of prices and the trading volume it is possible to allocate the repeating patterns and trends to define the general condition of the market.
No strict classification exists, there is only a set of techniques which were developed absolutely independently, among them there is also rather simple, for example, Price Action or indicatorless systems, and superdifficult neural algorithms. Sometimes separate methods in general contradict to each other and then the principles of the theory of Dow is the only thing that unites them. Let's list only the main groups.
Methods of the analysis of graphic structures
They are based on search and an interpretation of the repeating templates (patterns) and the forecast of similar behavior of the price. Don't require to use of difficult software and rather simple in use, for example, the graphic and candle analysis, Price Action.
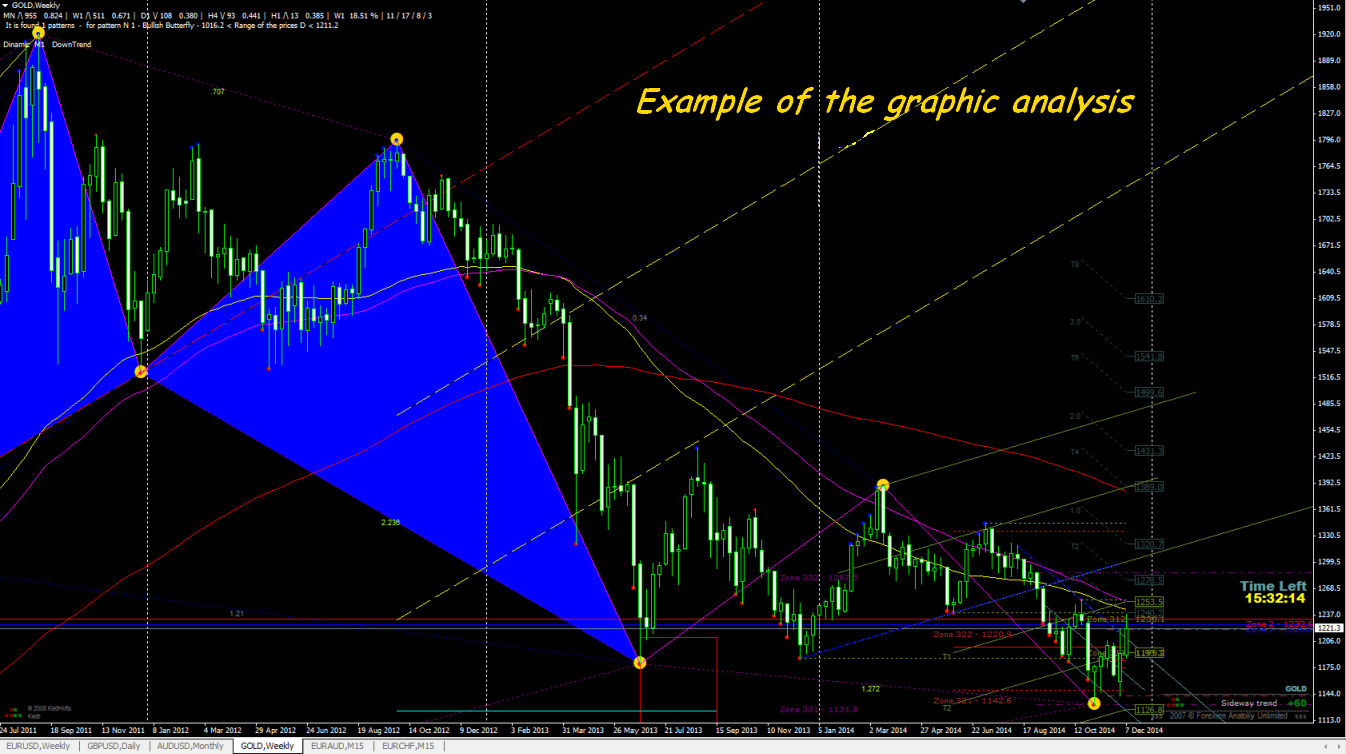
Shortcoming: subjective perception and instability of graphic constructions.
Methods of the statistical analysis and modeling
The most popular group: the indicator and probabilistic methods using any mathematical approximation of price and time lines for determination of parameters of a trend, probability of a turn and correction.
Shortcomings: delay, averaging and high requirements to properties accuracy.
Analysis of option levels
The method requires the analysis of external data from the currency futures and options market and allows to see levels of a congestion of the postponed orders, volumes of transactions, opened interest and other useful data.
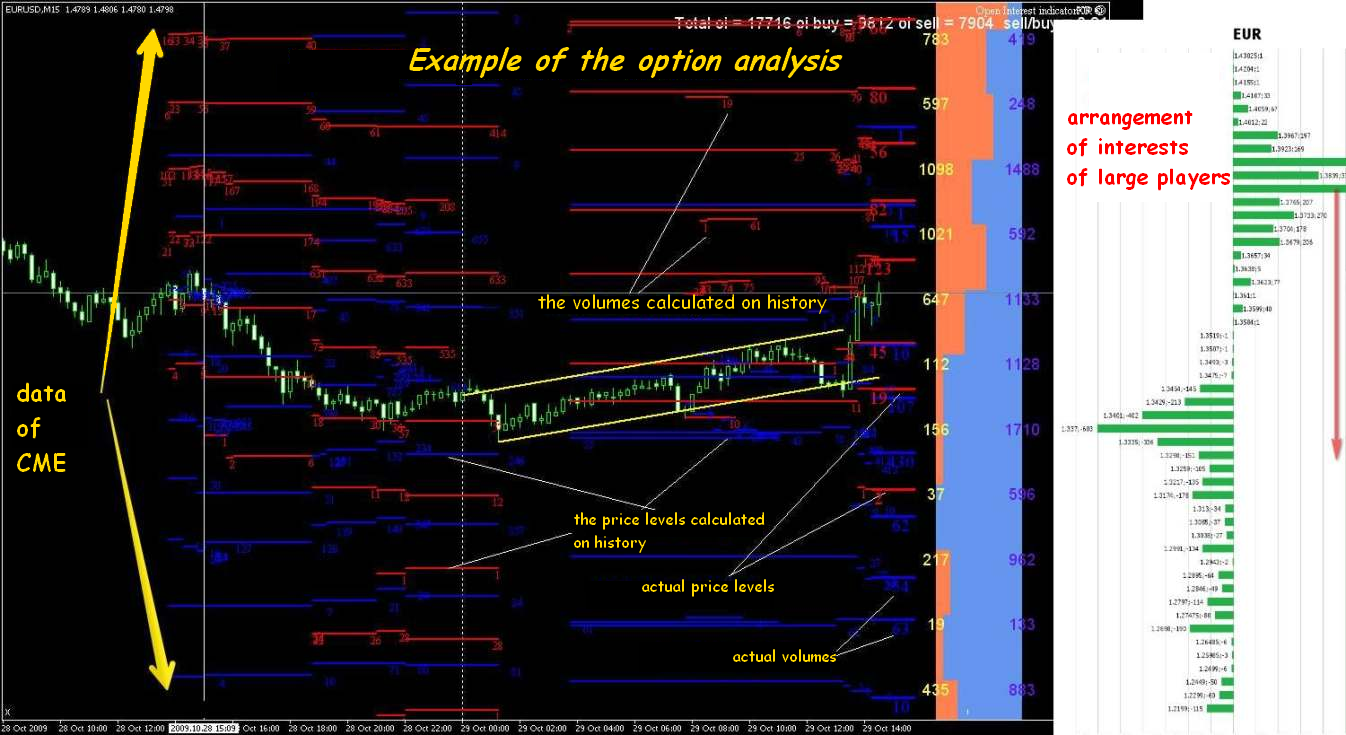
It is recommended only to experienced traders along with the indicator analysis. Has no contraindications.
Methods of the analysis of market structure
Base is the idea that the movement of the price takes accurately structured form allowing to make the reliable estimation of further behavior. For example: Elliott (Woolf's) waves, fractals, market profile.
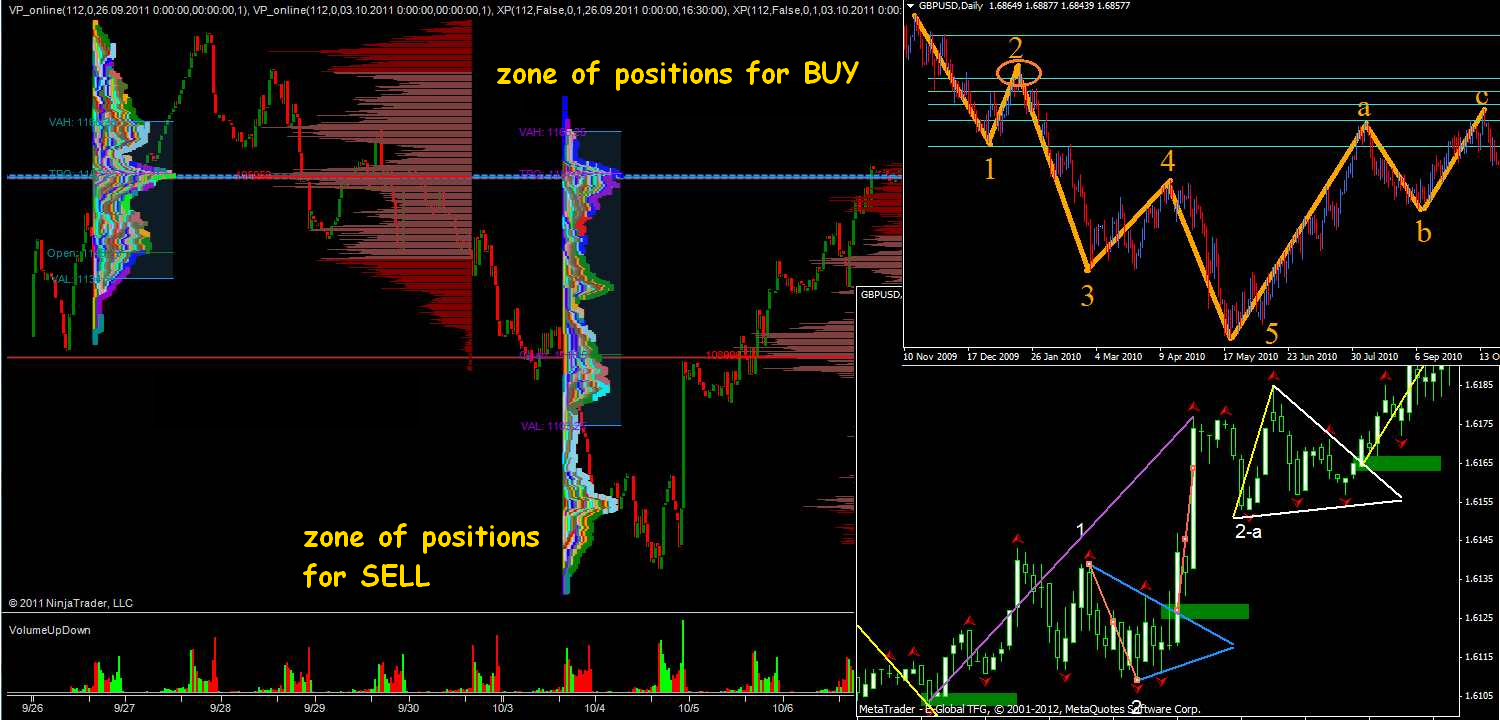
Shortcomings: subjectivity of perception, instability and an incorrectness of similar systems, especially on the small periods. It is recommended to use only along with indicator methods.
Approximate scheme of the obligatory technical analysis
On all workers the timeframes you should estimate:
- the direction of a trend (ascending, descending or flat);
- force (phase) of the main trend (beginning, main movement or end);
- probability of a turn of the current tendency;
- volume structure of the market;
- strong price levels;
- volatility of a trade asset.
It is possible to use separate indicators for each of the parameters, but the combined options are more preferably. Anyway, not to lose money, the working trade system has to contain such tools of the technical analysis which in any trade situation with sufficient accuracy will answer three questions:
- How the market gives a trade signal?
- How this signal is confirmed?
- How to understand that the signal wasn't confirmed?
An accurately developed action program in any of possible market situations is the result of completed Forex technical analysis.
And as the conclusion …
The technical analysis is especially criticized by those who want to receive the 100% estimation of the market by means of mathematical techniques, forgetting that its basic task – only to estimate a situation in the market at that point. Any critics need to remind that processing of huge volume of data of the price history which is saved up for one hundred years is possible only by statistical methods in the application software today. Technical analysis Forex has allowed to formalize the main methods of calculations and has made possible development of automatic trade systems, including high-frequency trading.
There is a non-profit organization The International Federation of Technical Analysts (IFTA) which is engaged in studying and accumulation of market information, the organization of business conferences, supports social communications according to the technical analysis and carries out certification of technical analysts of the financial market.
If someone tries to convince you that the technical analysis is much simpler fundamental − don't trust. His development requires a lot of time and continuous personal development. But universality and flexibility remains its main advantage: the same tools are used to a research of any types of financial assets and − on any timeframe.
Today it isn't important what signals are the base for you to make the final trade decision and how this decision is influenced by a fundamental background − if you not Warren Buffett or the market maker then you won't to do anything without technical analysis. The optimum entry point or closings is defined by technical indicators of the market. It is always necessary to remember that the bulk of small and average market players has no access to important fundamental information and trade generally on TA, and therefore ignorance of his basic concepts will quickly leave you out of the market.
Social button for Joomla