

")
Everyone heard this popular word, along with dozens of stories, that you may easy and fast earn on they. But Forex correlation as indicator of direct and implied connections between trading assets can be not only profitable, but also dangerous, therefore work with them requires considerable practice and serious approach to risk.
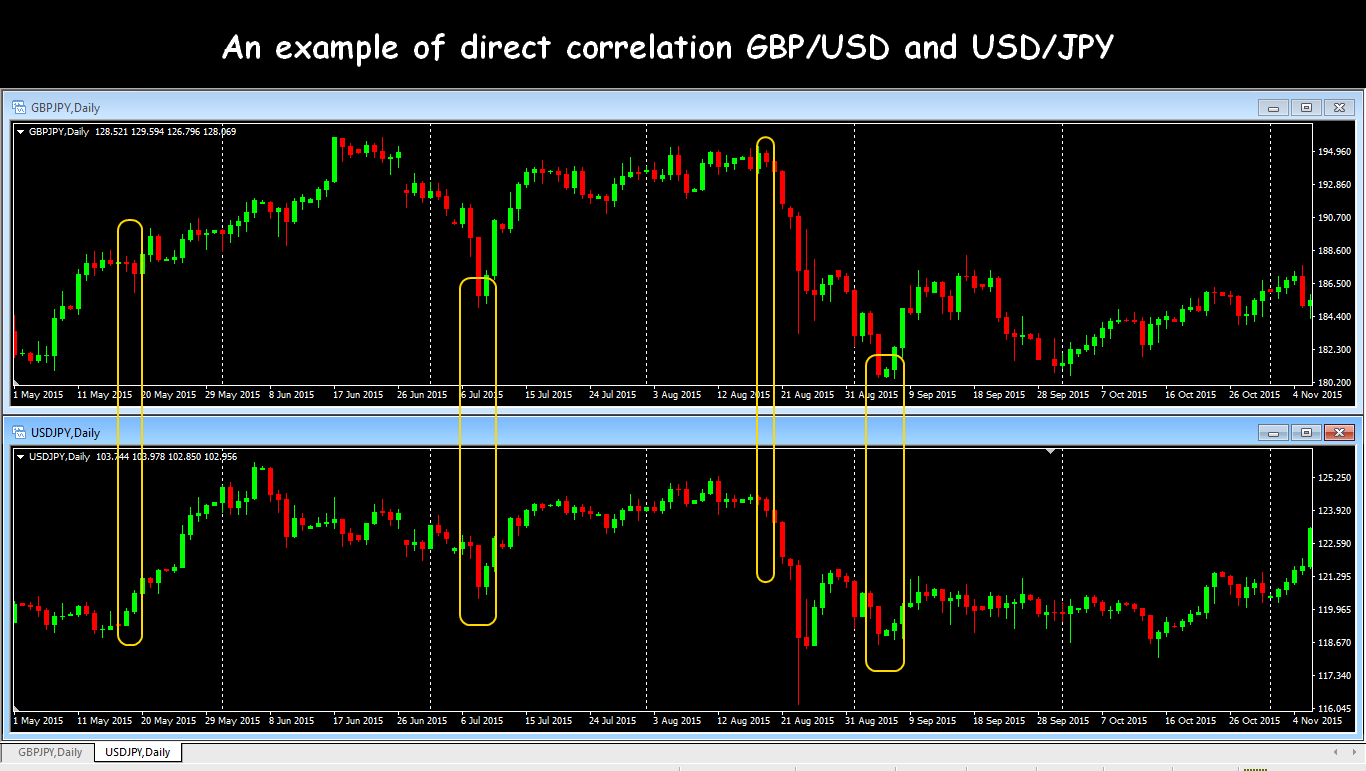
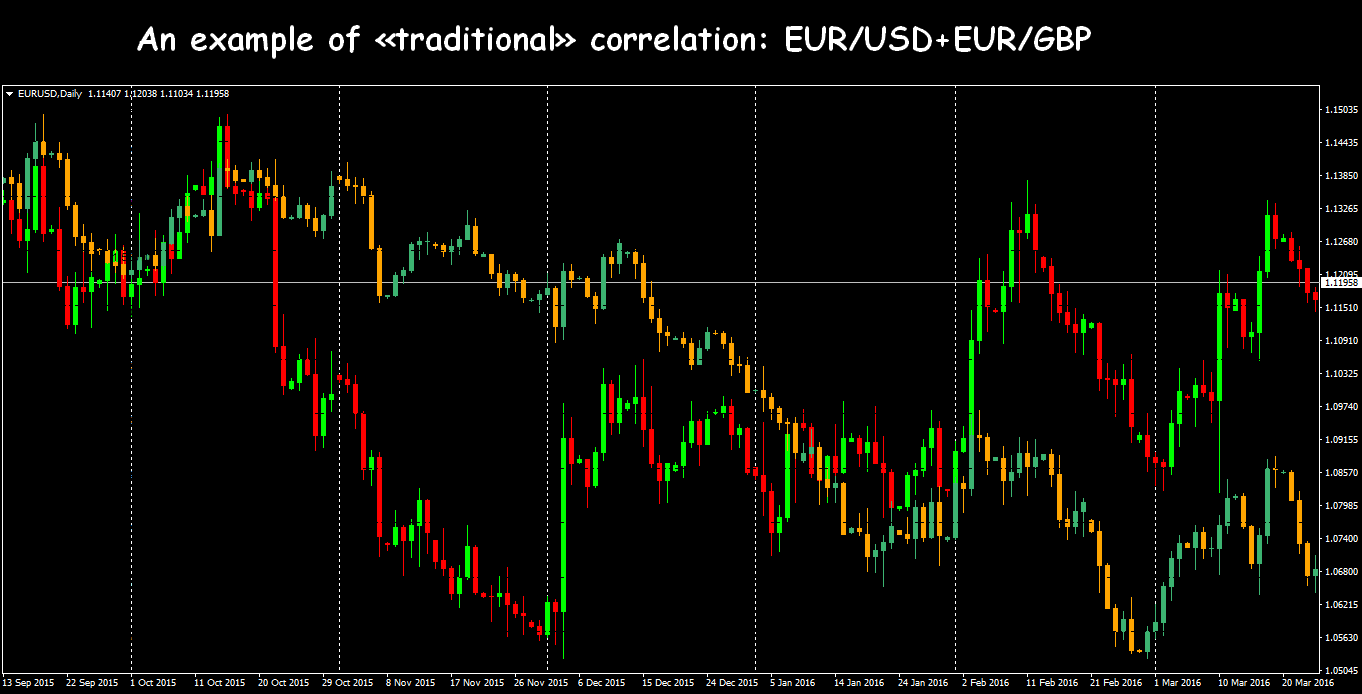
Let us recall: correlation is the connection between several of trading assets, caused by fundamental and other reasons, which obviously or hidden influence on rate of the trading asset. Meaning correlation estimates a power of this connection in the context of maximum probability of simultaneous movement, in other words usefulness of this fact for making profit. Correlation of currency pair may be direct or reverse.
World economic, political and social conditions are continuously changing, many new factors are appeared, which influence on market balance of demand/offer. As for now, many customary, «historically checked» Forex correlations, for instance, such as EUR/USD – USD/CHF, are hardly suitable for trade, and the new connections should be checked individually.
A little bit theory
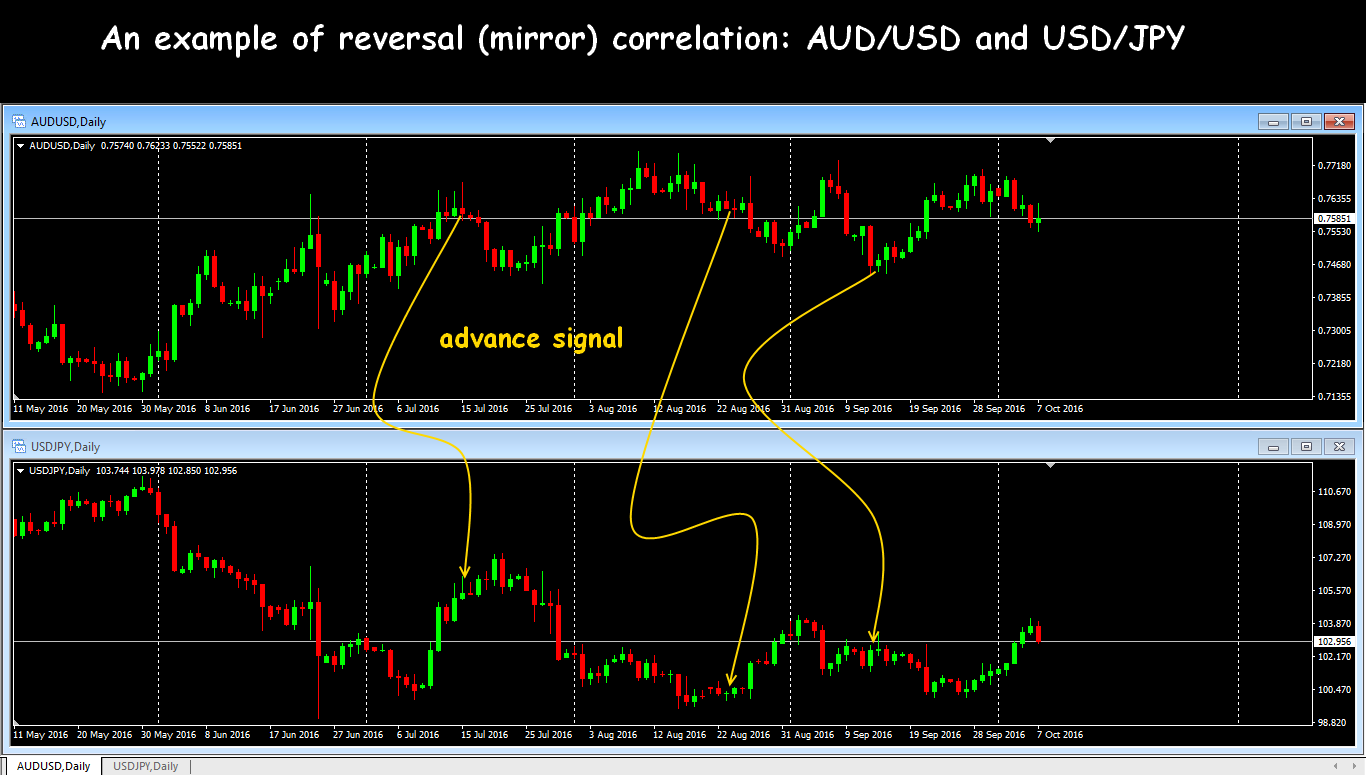
Forex correlation is traditionally used in technical analysis as trend, more often, advanced indicator, as well as on trading with one asset. Correlation is estimating in the rate of (-1) to (+1), index 0 means that the movements of the chosen currency pairs has no connected dynamics. Correlation (+1) means that the assets prices are moving synchronously in common direction, correlation (-1) – in opposite. A range of values (+0.3; -0.3) should be considered as weak and unreliable correlations, values (±) 0.5 are regarded as significant, values (±)0.7 – are strong.
The longer period of calculation of the correlation− the better. Data of calculations on 20-40 bars (periods) are minimally reliable, indexes calculated on 100 and more bars have more credibility.
All strong correlations (between any assets!) always have fundamental reasons. One of the most strong reason is the hard regulation of currency rate (as with yuan) or legal connection between rate of the one currency to another, as was in package EUR+CHF. It was the reason why the currencies in pairs with dollar showed a strong correlation and was in some flat in accordance to each other for years. Sometimes such regulation may be connected with especial agreements, for instance, between Denmark and EU.
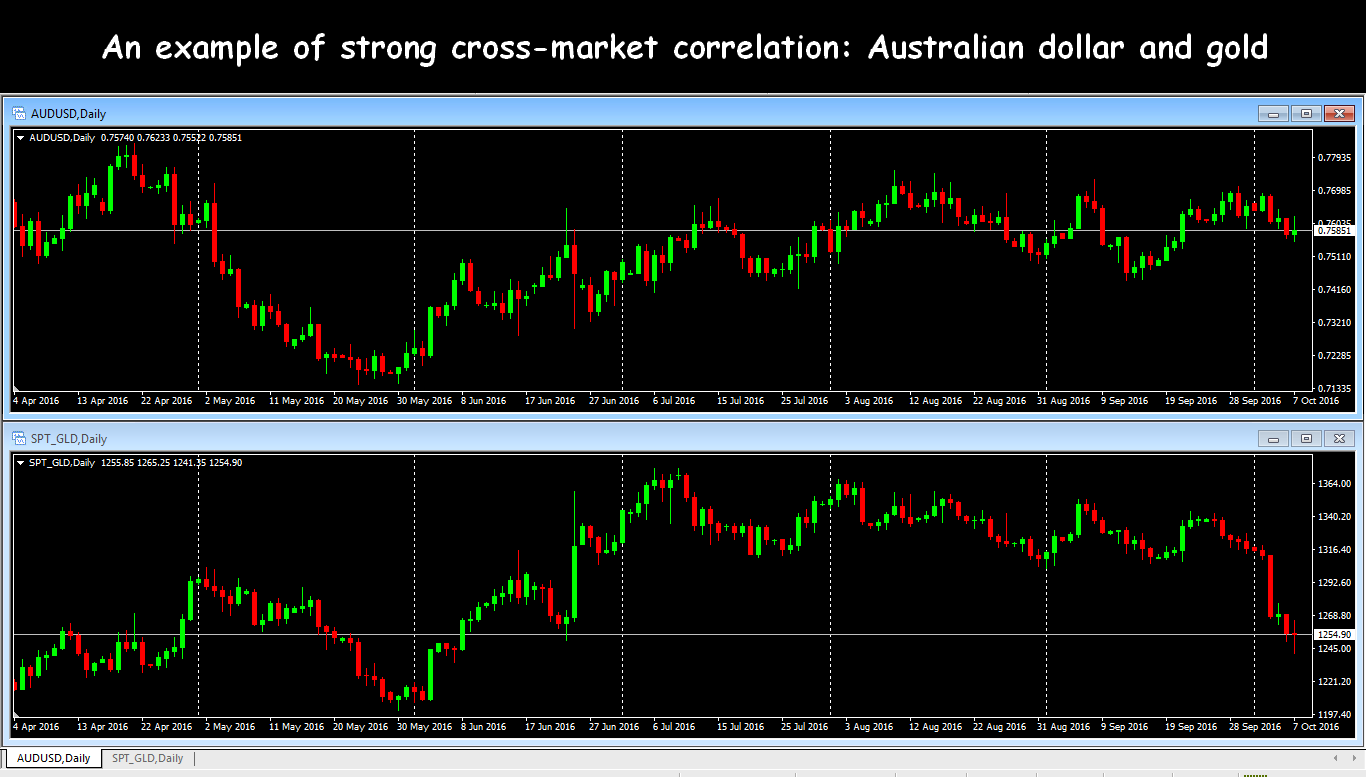
The strongest correlation is subject to raw material resources, connected with differences of the economies of specific countries. Common delays and advances are connected with how the economy of specific country reacts on fundamental information, which determines a price movement. Reaction on economical statistic (for instance, export – import) on stronger economy can change sharply a demand on its currency and demand on currencies of the countries, which connected with the trading relations.
Of course, high calculated value of current correlation between assets not means synchronous movement at all. Not always on chosen timeframe the pairs moves in accordance to the global tendency, therefore, if you trade on M15 – begin with analysis of the current correlation on this period. From the trade point of view the more profitable for trade is a basket of assets, which have a strong interdependency.
Trading tasks on work with correlation
Correlation should be counted consistently in estimating complicated investment risk. Sometimes, when you invest in different assets, it seems like you successfully diversify your portfolio, but in practice many of them may move synchronously in one or reverse directions. Believe, it makes double loss more often, than double profit, and correct estimation of the current correlation is decisive.
For stable profit you should quite clear understand dependence your portfolio on volatility of the market. The correlation can be:
- uniform assets between to each other (for instance, currency pairs);
- financial assets with stock indexes;
- financial assets with commercial or raw material.
Reasonable trade with estimation of correlation allows to diversify risks, for instance, different reaction speed of currency pairs EUR/USD and AUD/USD on dollar fall allows to minimize the risk when the general tendency is constant. Besides, you may hedge unprofitable positions on mirror correlation, by using different changing speed of allied pairs.
Correlation may be useful even in graphical analysis: if you see a pattern, but you are not sure in its quality, so a check of other pairs is the perfect possibility for a check. Should the pattern is «curve» on the allied assets, it`s better not to trade it at all.
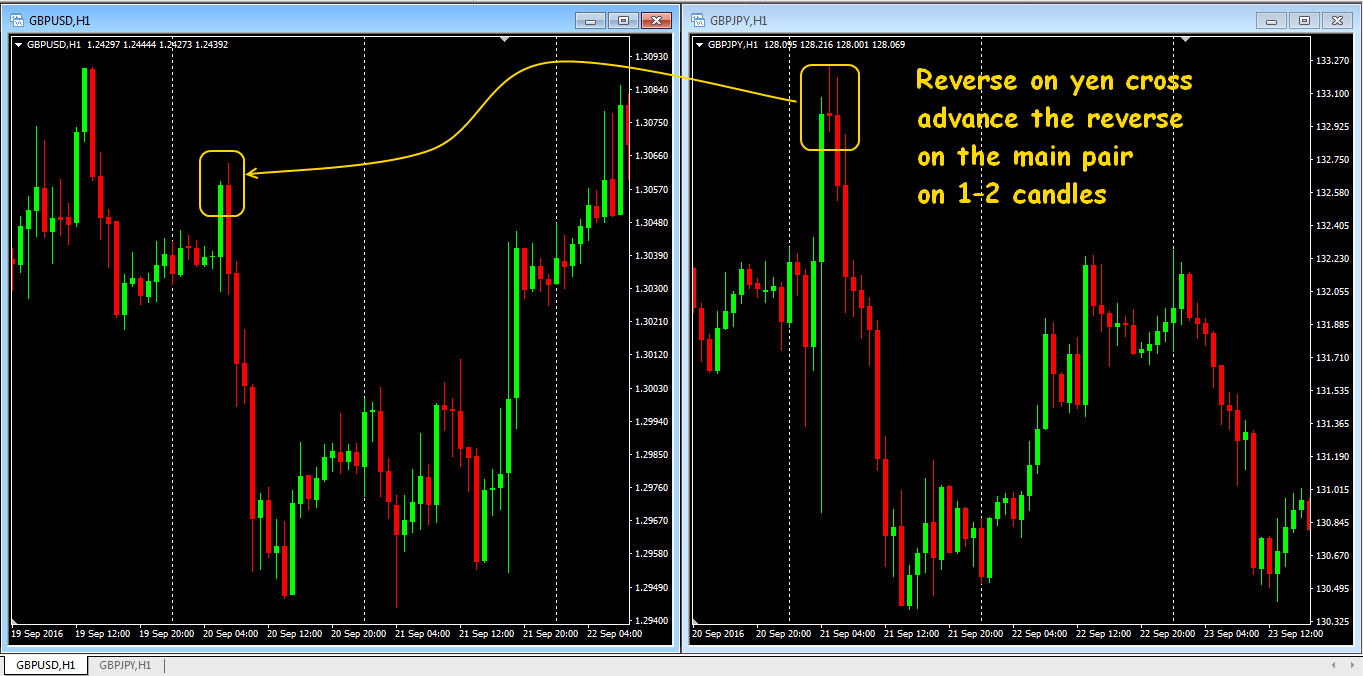
If the breakthrough on main pair or level fixation are visible, you may open a deal on correlated asset, as it will be more correct entrance (in most cases). You may see points of strong reverse upon analysis of the day charts, and, respectively, open on shorter periods.
Those who holds medium-term or longer positions need take into account that approximately in 1-3 days prior to date of an expiration of large options or calendar closing of futures, especially raw material, correlation trading signals can't be trusted.
Let`s look some examples.
Trading strategy on the basis of currency pairs correlation
A scheme of the simplest trade on correlation looks approximately like this:
We open a position on an asset 1 pending that price will reach some level. At the same time we watch the asset 2, having strong connection with the first one, which shall move synchronously: in one direction – in case of positive correlation or in opposite direction – in case of negative.
We suppose the price of the first asset achieve some target level. If the asset 1 is slowed down on our profitable way, if it comes at flat and make «hints» on a reverse, we analyze the second asset to prove such signals. If allied asset continue to be well on the way to the same direction, then should holding opened the main position. If the second asset gives the signals on reverse (or stop) – we close the deal, or, at least, hitch up a stop.
Anyway the signal from «ally» allows to estimate probability of the further movement of main tool and not to open contradictory deals. If synchronous movement of correlating assets is quite strong, you may open position on the second asset too, of course, subject to rules of moneymanagement. An entrance on several assets always means doubled risk in deal and, as a rule, such entrances are not especially profitable on the periods longer than H4, but on M5-M30 the difference in speed can be quite tangible and similar risk is justified. More often, on the basis of correlation choose one, the most profitable signal.
System of the pair trading
The pair trading is constructed on the same principle of the use of correlation, only it is applied to any assets (stocks, indexes, futures, CFD, options) with high divergence rate. The goal is a sale of the most expensive asset and a purchase of the cheapest. Thought for such trading minimum fundamental analysis is required, but visually special technical indicators shows a divergence between the assets, and help in real time combine the charts of the two (or more) assets on the one screen. The popular indicator OverLayChart or script Correlations, which help to find and estimate connected assets, including CFD-contracts, are the examples of such tools.
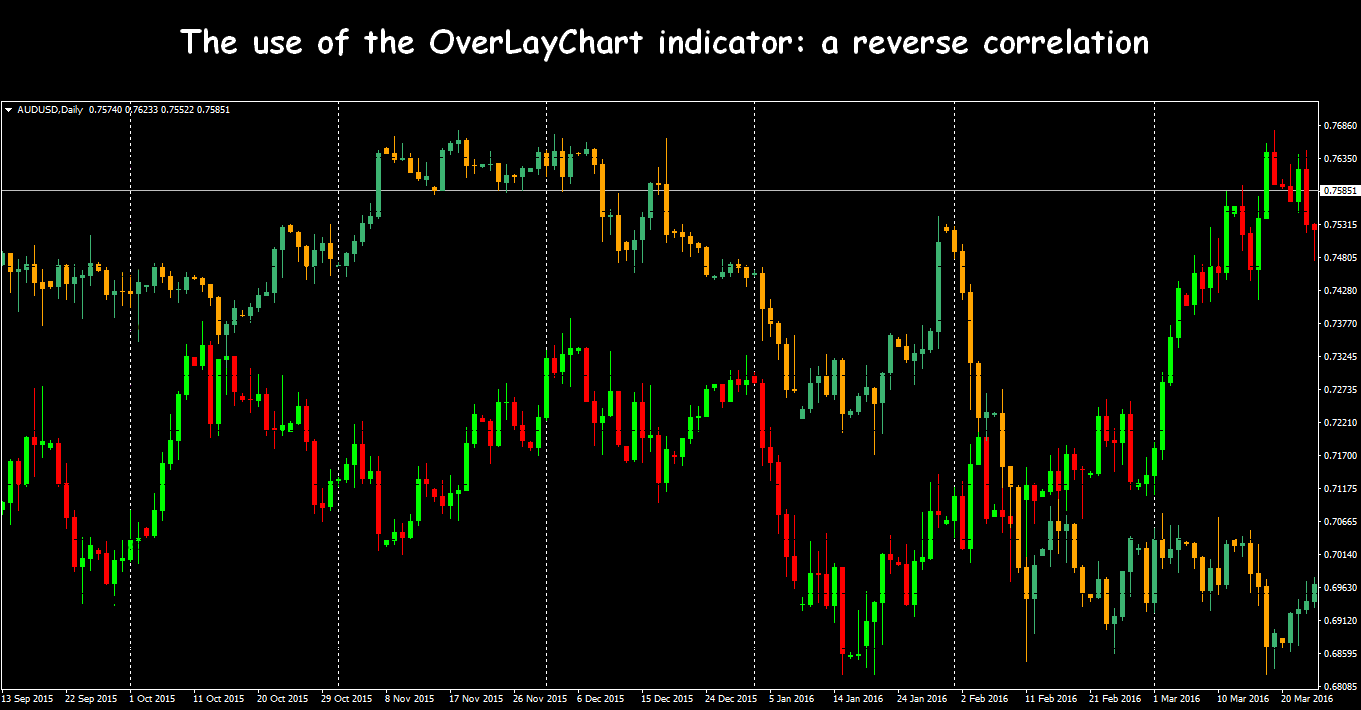
In case of correct use the technique of the pair trading gives fabulous results, but you won`t to do this without base. Such strategy has no exact rules, entrances are defined only by technique and with low accuracy, so your deals should not belie the common sense.
Strategy: pattern – Fibo`s levels – correlation
The universal counter-trading technique of trade on trend breakthrough, which includes trend elements, Fibonacci levels and correlation indicators of currency pairs. Timeframe from H4 to D1. Basic elements: trend line and Fibonacci levels.
On obviously downward trend we build a trend line through local min, which will be as the level of resistance. Build a Fibo`s net from the point of the beginning of correction to end point, wait for the candle cross the line of 100% and close behind it, after that enter on purchase on the level of new candle opening.
A supporting line is building on upward trend not less than on two local max, and Fibo`s net – from the beginning of correction movement to the last point of rebound from the trend line (min/max correction).
Fix the StopLoss on the level 0.00% Fibo`s net (min correction). We recommend to fix TakeProfit on Fibo`s significant levels (161.8, 261.8). In case of steady signal you can open several trade positions with the same lots and stop levels.
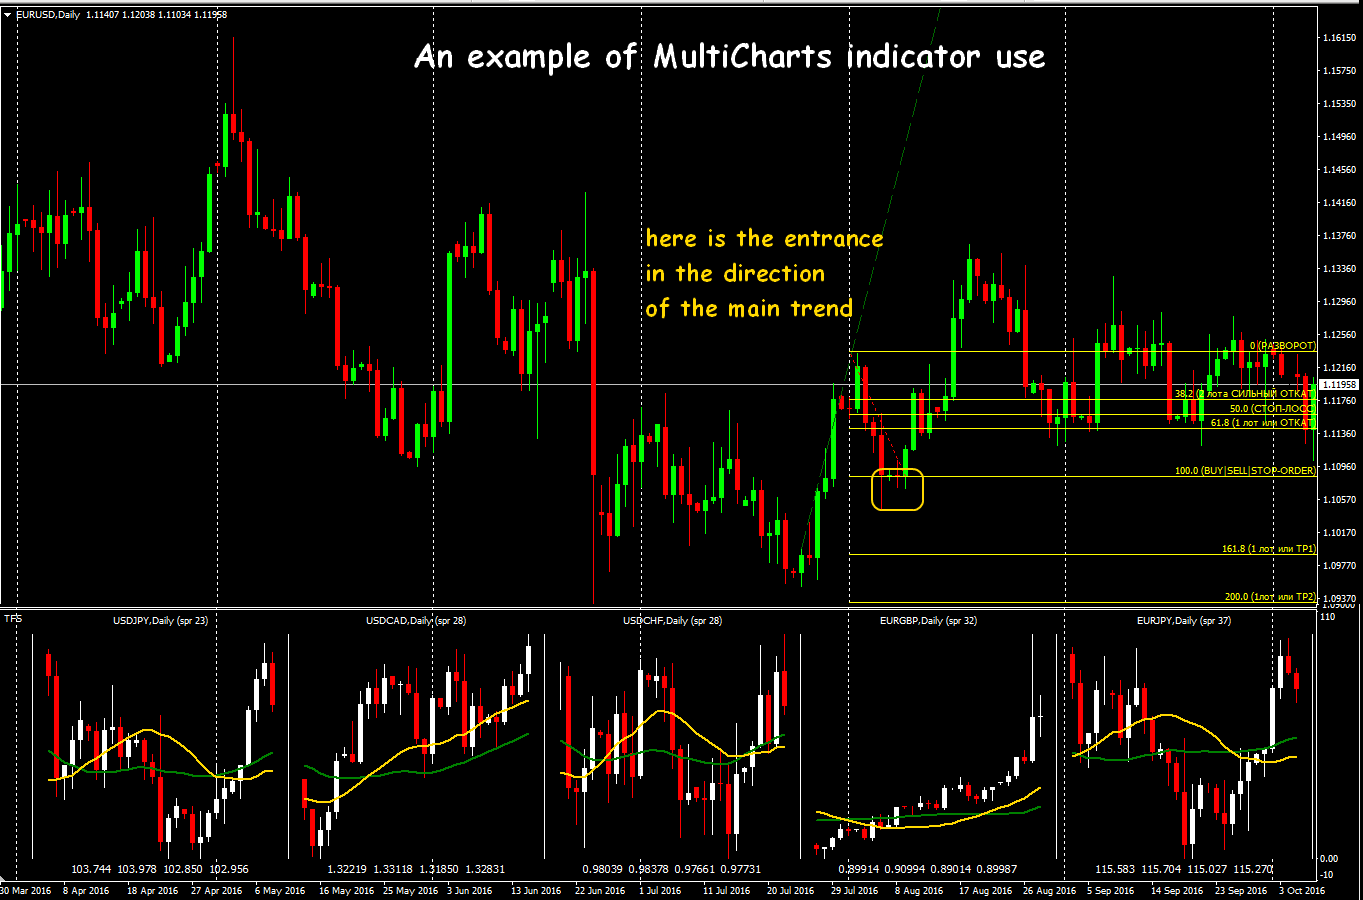
Multicharts indicator is used as a correlational element for strengthening signal by correlation of currency pairs. Multicharts shows on the price chart the movement of several currency pairs, each of them in respective mini window with SMA(21) and SMA(38) lines (properties for D1). As an annex for chosen EUR/USD in the instance we take allied: two pairs with positive correlation - EUR/JPY and EUR/GBP (for the confirmation of the main signal) and two with negative correlation - USD/CAD and USD/CHF (shows a growing signal).
When signals of main technique appears, we analyze current movement of additional currency pairs, for instance, if in case of price growth EUR/USD is the growth of price of currency pairs with positive correlation, than probability of upward price movement is increasing. In case of price growth of the main asset the currency pairs with negative correlation should fall.
Correlation dollar Index/Gold
Strong connection between gold and dollar was and will be always, because it has a «market» mysticism. Investors consider gold as cost unit (anything), continuously current hedge against inflation and free from risk alternative to paper money. It is a measure of the reverse dependence between dollar index and price of gold remain that central banks keep take steps to secure of liquidity of financial system.
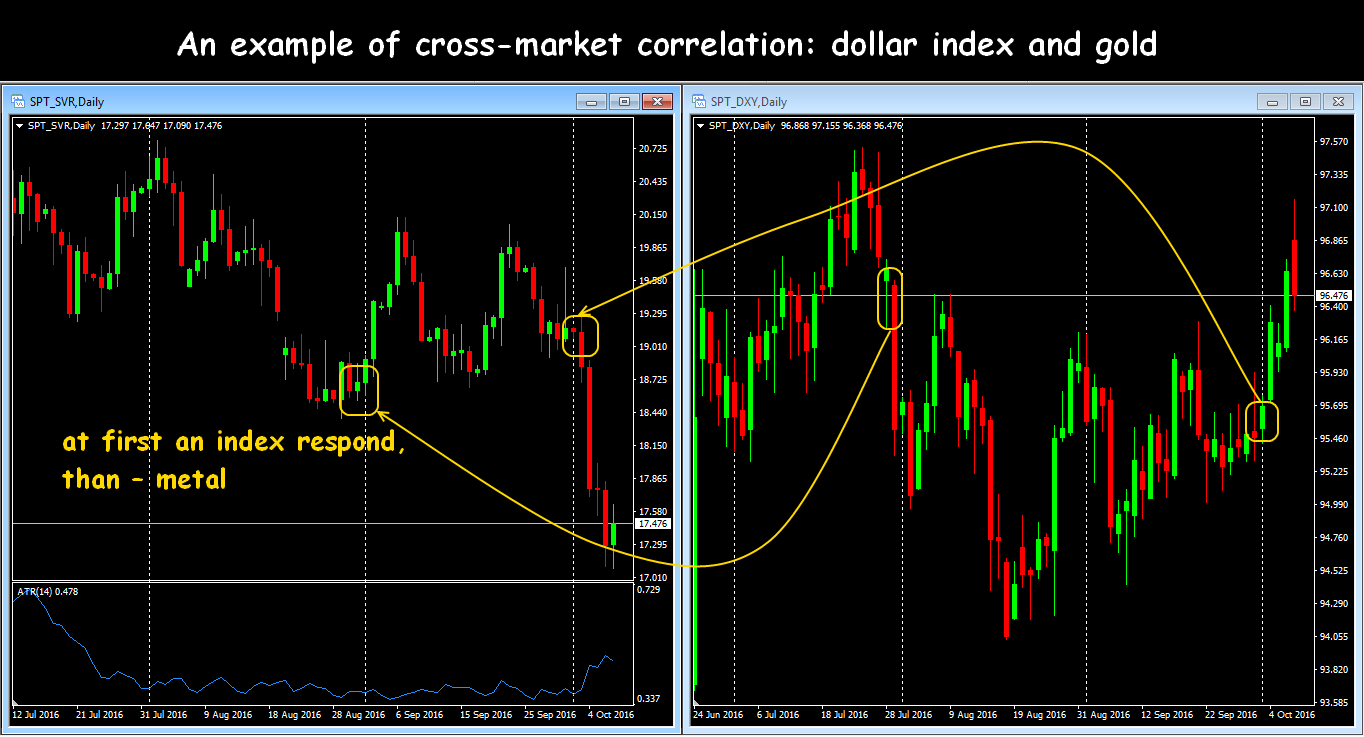
For trade is necessary: timeframe D1, indicator ATR, spot assets of dollar index (as advanced trigger) and of gold. For opening position is used technical levels of support/resistance on dollar index chart. Closed day candle lower than support level on dollar index means a signal for long position on gold. Closed candle by index higher than resistance level, respectively, signal for short position on gold. StopLoss – on ATR double range level of the previous candle, TakeProfit – on the level of ratio of risk and profit 1:3.
Correlation Oil/cross CAD/JPY
Canada is the clean oil exporter, its resources less only to Saudi Arabia, that`s why Canadian dollar keep best currency for making profit out of dynamics of oil prices. Logic is ordinary: use positive correlation between basic raw material and currency cross CAD/JPY, trigger is oil price. Technique especially suits to them, who want to trade on oil, but has no enough deposit (or experience), to win volatility connected with.
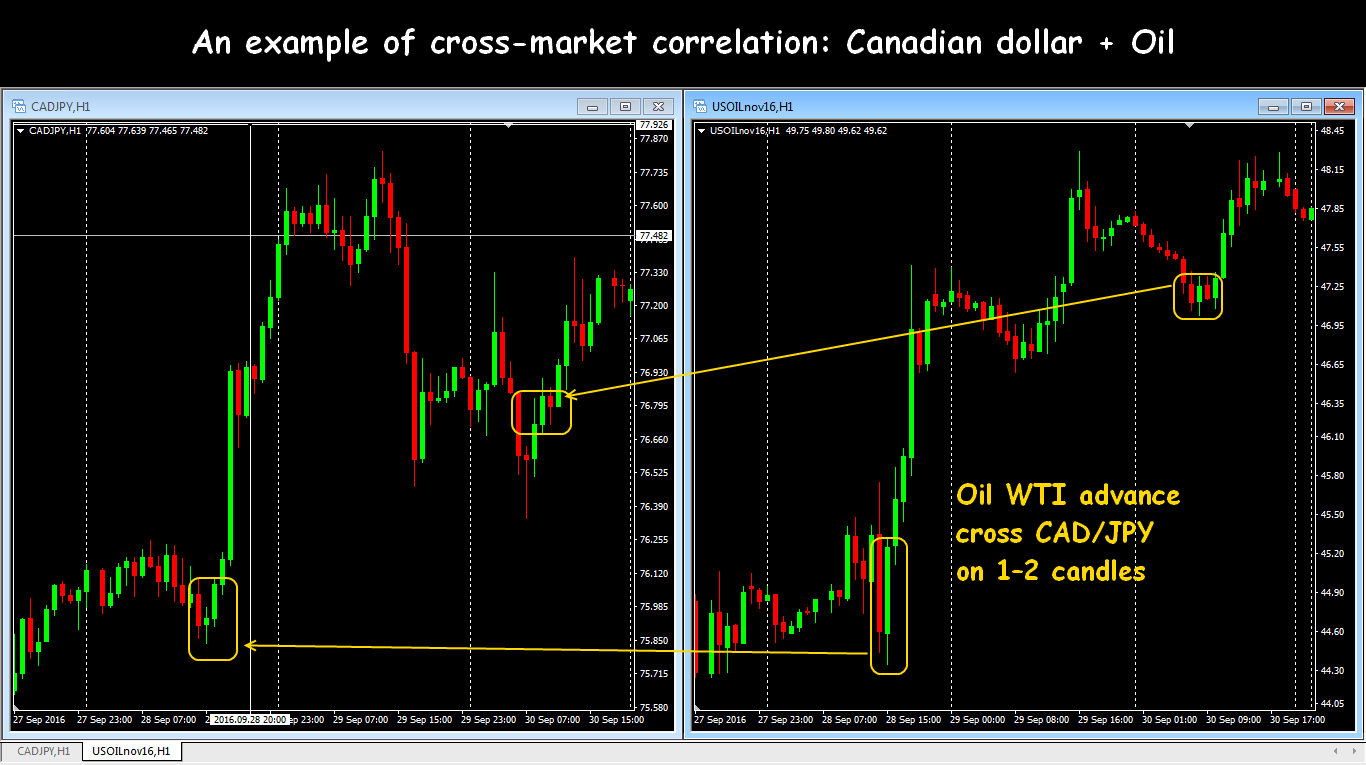
The pair CAD/JPY have the best correlation with oil, because Japan has no such raw materials, price grow on oil lead to reduction of Japanese economic data and is cause, respectively, fall of yen rate. At last 2 -3 years Forex correlation between oi price and CAD/JPY is on level 85%.
Some word about domino effect
More simply, this is chain reaction of group of assets with high rate correlation upon sharp move one of the components. In particular currencies is going through this effect: in case of market «anger» the leading pairs reacts first, and the others activates after some delay. The truth is leading and run behind pairs permanently changes the places – it connects of anger.
Chain reactions in case of correlation on Forex are quite often, but understanding of the fundamental analysisbase and good skill of watching the market is necessary. In accordance with the effective market idea, all the information should be shown on market rates immediately and in full. The problem is the concept «immediately» doesn`t mean «at the same time», each of the assets have the power levels, allocation of activity on time, dynamics of levels and other conditions, but should some disproportion is appeared, than it will close for sure. Domino effect reflects the reaction delay on common factor.
For instance, if something happen in Asian session, and, let`s imaging, yen breakthrough some power level, the reaction of other currency pairs appears in periods of their most activity. It makes common the domino effect with arbitral strategies, but it`s period is shorter – from 1 day to week.
Most of traders works on main currency pairs and just could not see such domino effect, because they have no habit to analyze assets by group, and to search unpopular currency pairs. It`s important to choose correctly the first correlative pair in a group (it will be a messenger of new trend) and the most delay- you could close a series of deals. Let`s watch two specific examples.
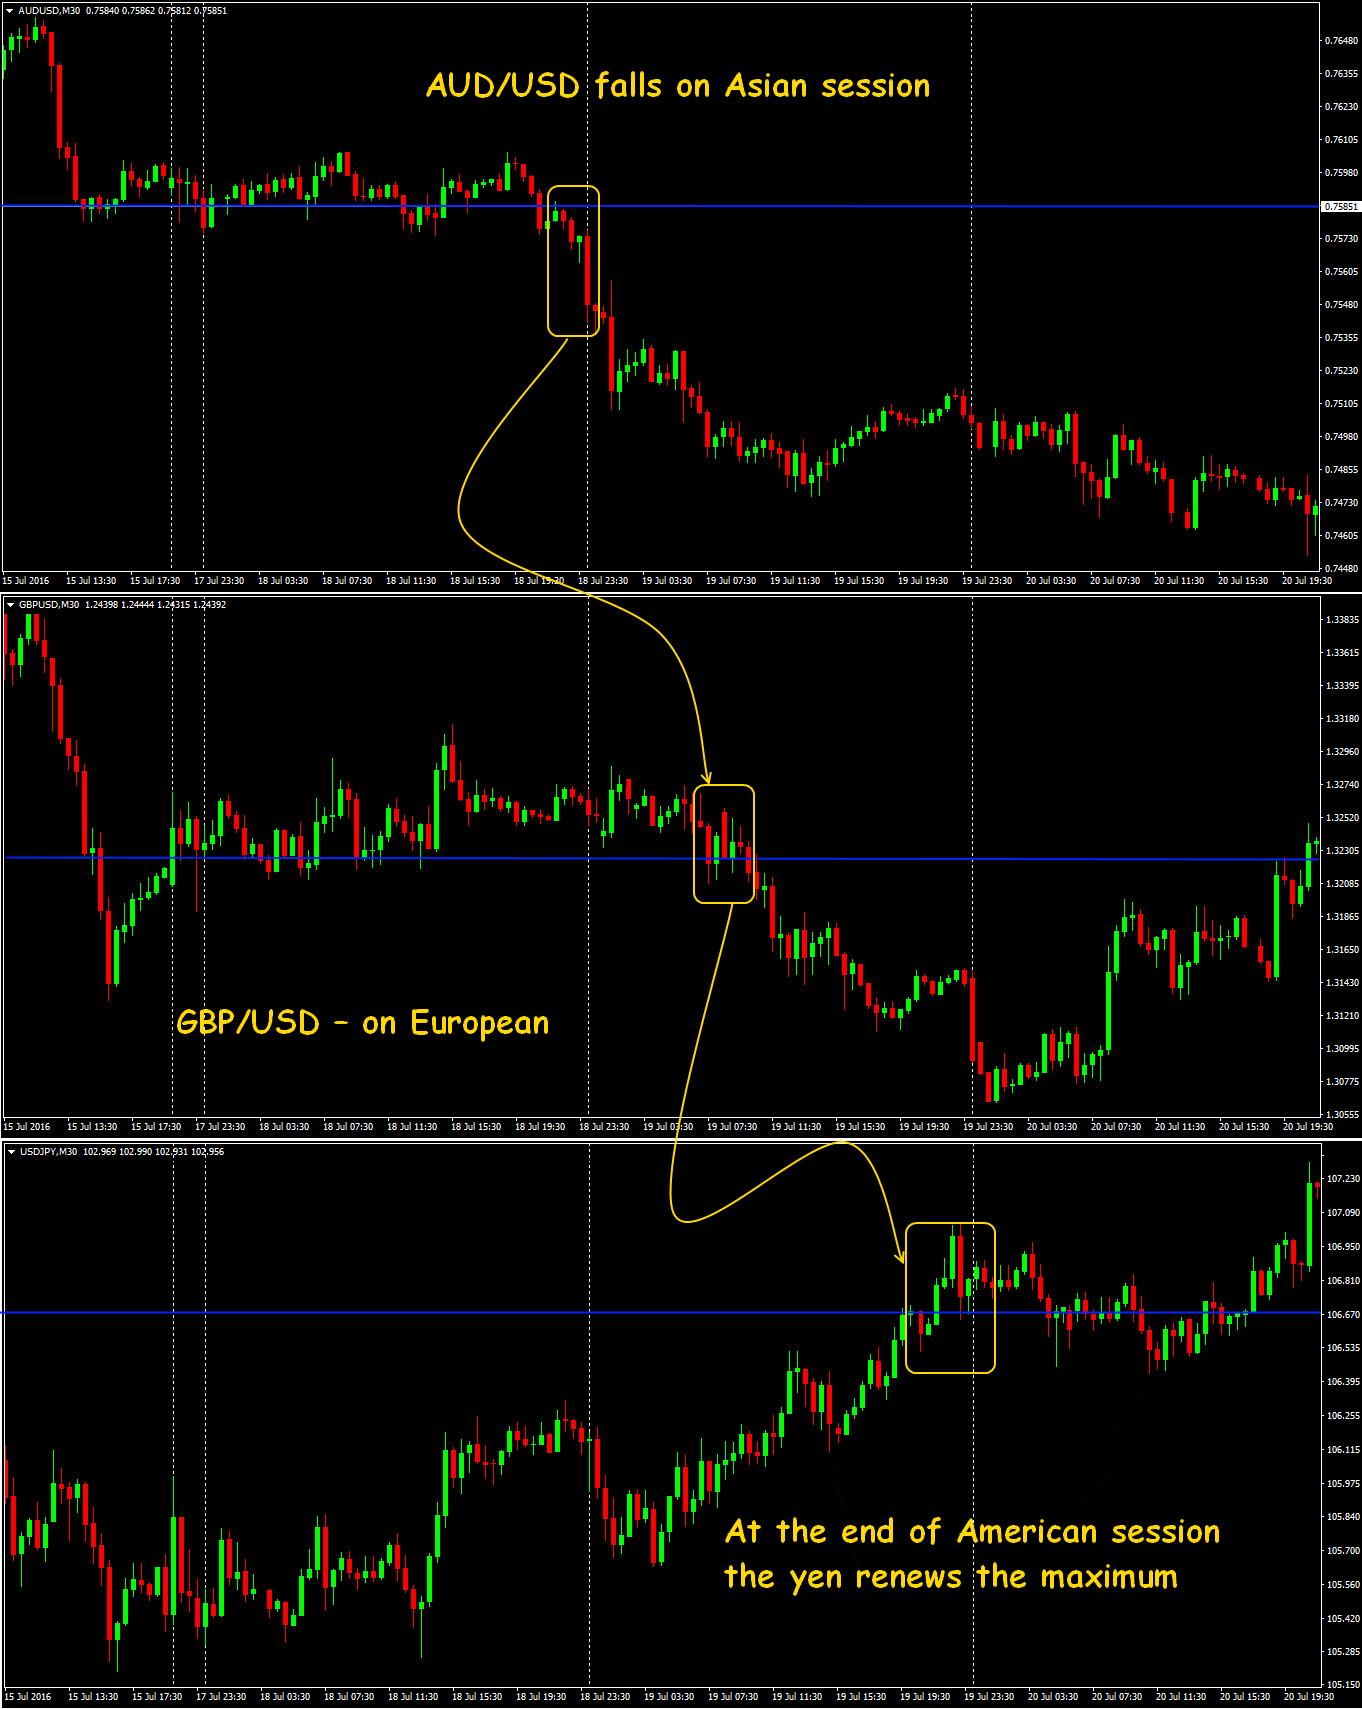
«Breakthrough of the strong levels» situation
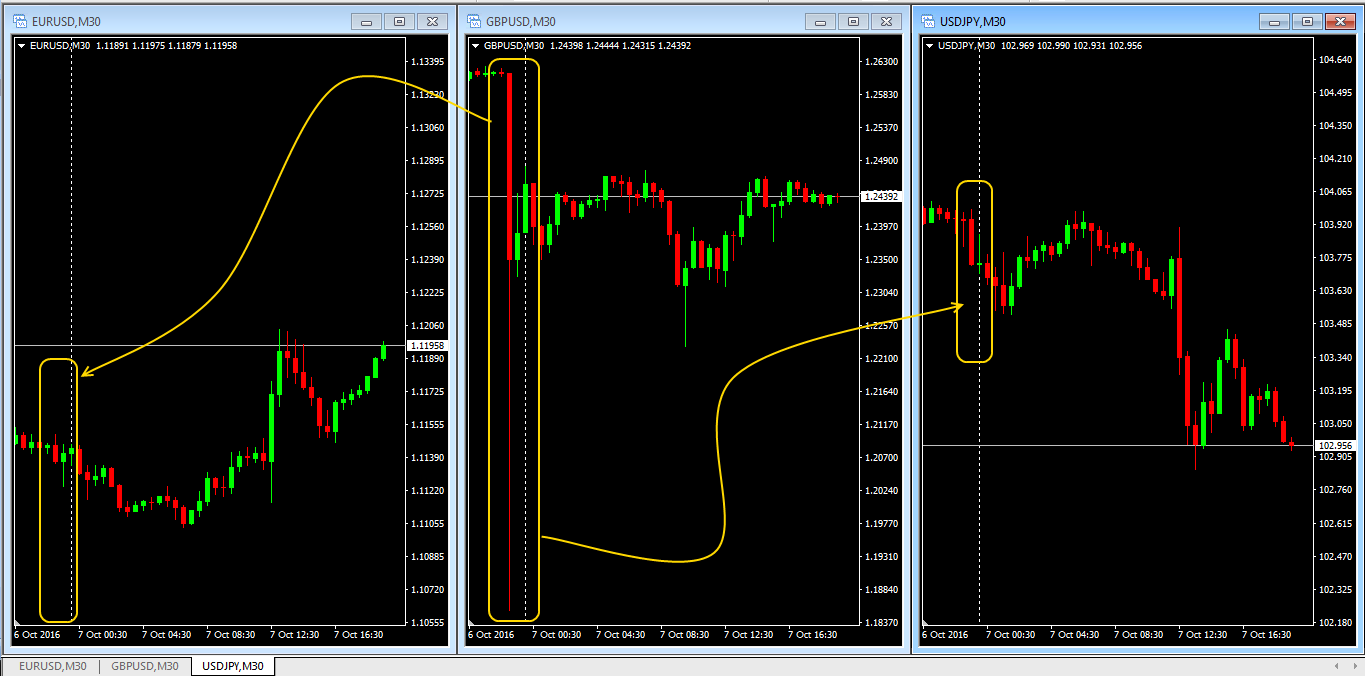
On the strong cross-market base as a beginning of domino effect works an AUD/USD pair, which in its session (Asia) breakthrough it`s strong level, formed during some days. After London is opened GBP/USD renews minimum too. And at the same day in American session USD/JPY, the last chip of the line, falls, which close a series, by renewing of maximum of the same period. Look at the picture.
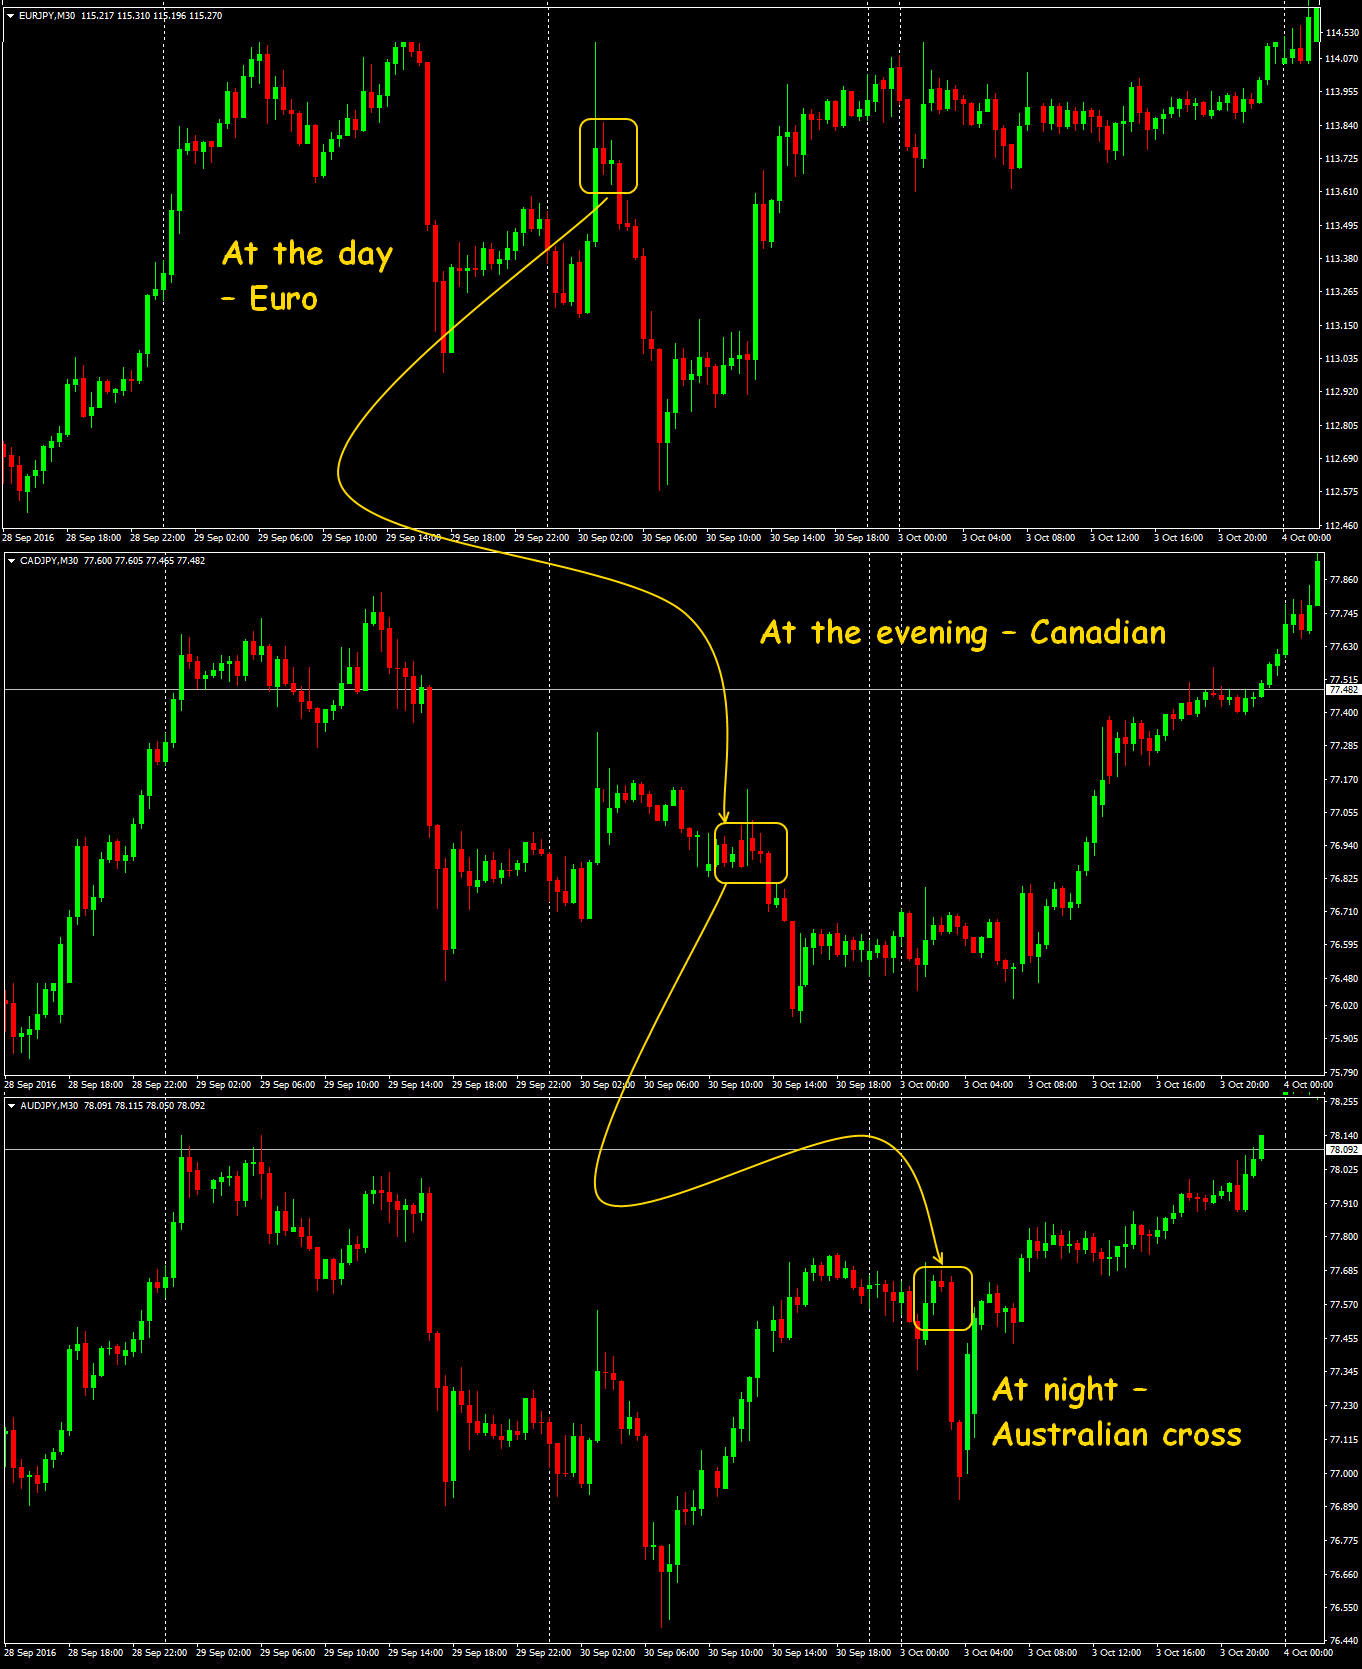
«The power of the single participant» situation
The effect is because of strong yen some of yen pairs falls at its session. Disproportion was eliminated at the next day – all yen pairs keep fall, and USD/JPY fall with double «speed».
Some remarks on analysis
Forex correlation is not a casual relationships between events. That is the fact, if the assets pair demonstrates high correlation, it doesn’t mean the movement of one asset caused the movement of the other. Most often, «wise» analysts just after fact of movement tries to correct the base under the result and declares the stock market increases, because of the American dollar falls, or the gold falls because of dollar increases. But then as a result of shallow informational searches you always can find more seriously factors, which explain such movements.
The most serious correlations (from the point of view of trade) cover at least middle-term periods, but it don`t give reliable signals for short-term trade (the most popular!). And should not forget that checked by years connections breaks very fast today – within a few hours or days.
Financial markets are closely connected to each other, but because of its huge daily turnover Forex market work out long-term (5 – 10 years) tendencies, its nature – short-term tendencies. It`s important to understand for use of the short-term correlation which market is advanced in this moment, and which is delayed. Fundamental data or political events, and the technical analysis of allied (correlative) markets are the traditionally catalysts.
Different assets in different ways reacts on economical and other data. For instance, USD may increase on strong news or prospectus of rate grow, and it usually press on oil an goods. At the same time sharp reduction of oil reserves in USA cause a sharp grow oil price, which in such case do not pay attention to dollar.
Some market connections are obvious, and the others may seems more complicated, for instance, as influence of Asian stocks, American treasuries or raw oil prices on estimation of USD/JPY pair. Old connections are breaking, new are appears, that`s why Forex correlation, including cross-market, should be watching in dynamics. Capability to multivariative analysis comes with the practice, and at the first steps you may separate only the strongest and actual at this moment factor.
System correlation may change gradually, for instance, because of monetary regulation policy or strengthening of legal differences between the countries of the basic currencies. You may trade on short-time correlation on short timeframes – from M15 to H1, but you should remember that checked by years correlation between the assets loses when the complicated political and other elements are present. That`s why serious analysis of correlation requires of data researching on the period from 3 months to 1 year.
For instance, active fall of GBP/USD following the results 03.10.16 – 06.10.16 almost on 4 figures is not accompanied adequate reaction of «former» best partner – EUR/USD, but at the time of Flash Crash on night session 07.01.16 (unexpected loss by the pound of more than 7 figures!) any of the main currency pairs doesn`t react at all.
At the last year all raw material currencies, especially Australian dollar, shown strong correlation with dollar index. The growth of the currency pair without national or other fundamental news, which is accompanied by the grows of index, means presence on market strong speculators on purchase and you should join it.
And as the conclusion …
At present correlations between the currencies and allied markets are especially strong, that once again proves the importance of the fundamental analysis for Forex, even if you do not trade in stocks, bonds, goods. Risk diversification is the undeniable advantage of trade on few assets, because inadequate speculative movements on all pairs at the same time are practically impossible, and cataclysm like Brexit occurs ones a decade.
Forex correlation may be profitable as an element of trade system, only if you well understand (and check in practice!), and quite good know, which currency pair in you trade set is the fastest and pulls on the other assets. It allows to correctly set up a trade schedule, to choose an asset, direction, levels of risk.
The cause of the appearance (and changes) correlations are also the participants of the market, investors and traders, who speculate, hedge, invest, and also instinctive or intentionally «program» the market, creating short-term connections between assets. Development and expansion of the software of algorithmic trade and analysis, which permanently “research” correlation between different asset class (and make trade recommendations!), just strengthens this dynamics.
You should understand, that strong correlations exist not always, and not anywhere should look for it. Any correlation represents function of time and a result of fundamental events, which were (will be) important at this or that period of time. Power and value of correlation are defined by economical and market circumstances, which change over time.
But if somebody know how to steady earn on Forex correlation, than why not us?
Social button for Joomla