

")
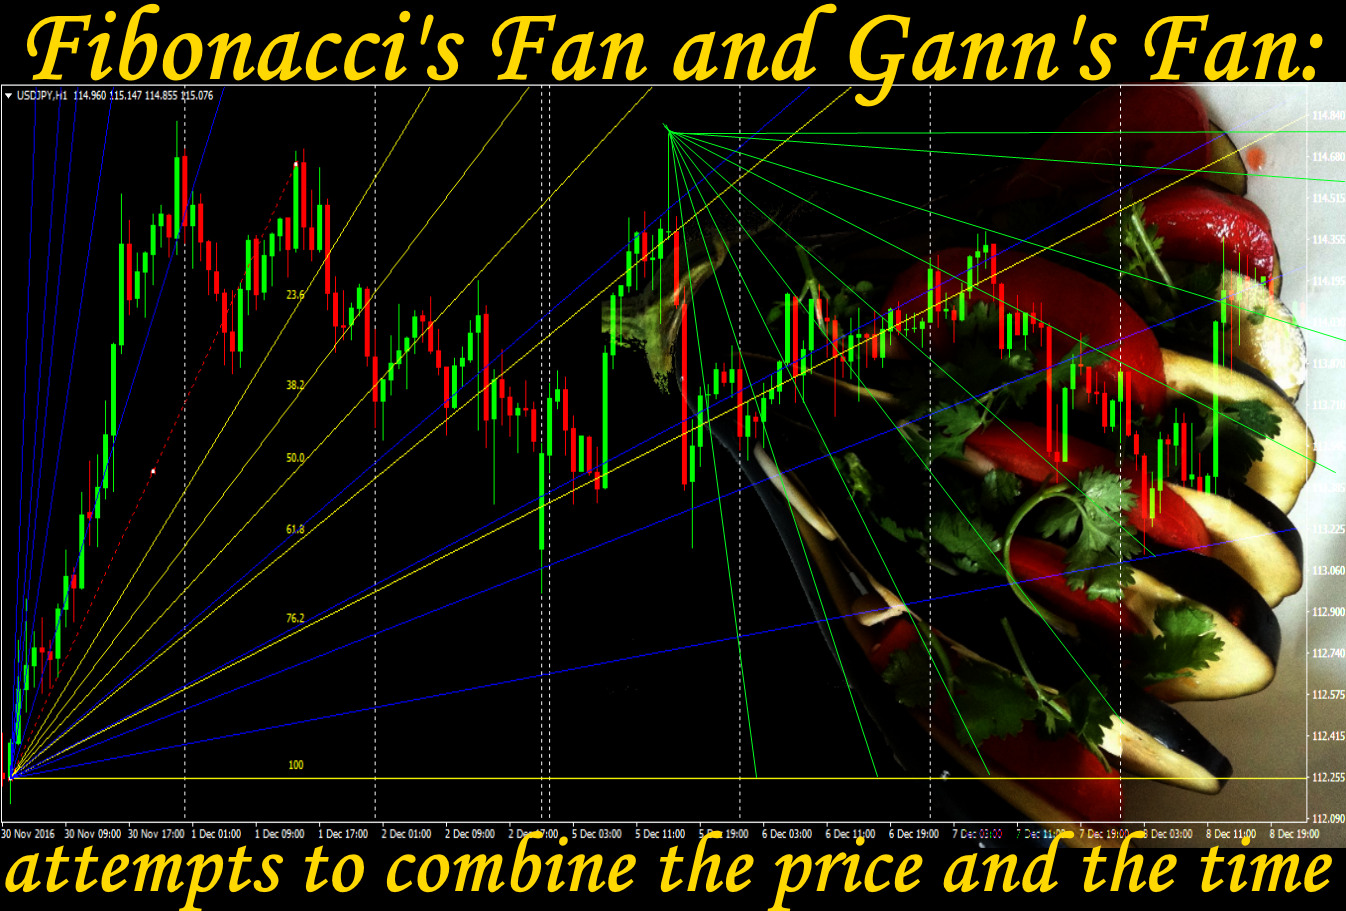
As a rule, it isn't enough to trader to determine a point of a turn and the most probable price, there is a wish also to calculate the moment of emergence of this price, that is to answer the most important question – «when». The correct creation of angular patterns as which special case are Fibonacci’s Fan and Gann’s Fan allows determining approximate «route» of the price including key time points on this way.
Attempts of the time forecast appeared together with the financial market, but today are the most complex challenge, especially for the ordinary trader. If with a priority of the technical analysis – to determine the direction, the price and the range of fluctuations − in case of a certain level of experience most of us at the very least copes, then attempts at least approximately determine the time when in the market “appears” that «technical» price – practically impossible. But if to determine (at least approximately!) a time span in which the probability of the specific price is highest it is possible to manage to be prepared and protected from market troubles and if carries – and to earn.
It is possible to use available standard means for this purpose as a first approximation though creation and an interpretation of price «angular» constructions require some experience. «Fan» structures are inclined lines of dynamic support/resistance with the single center and the general direction. The technical analysis traditionally connects a tilt angle of any price lines with the trend force, therefore, points of future crossings of such lines with horizontal price levels receive an additional safety margin. Let's remind briefly characteristics of the used necessary tools.
Fibonacci's Fan
Fibonacci's numbers are extremely popular in the financial markets just because most often confirm the fractal theory and Elliot`s wave theory. The traditional grid of the same name is a basis of Fibonacci`s Fan, rather three basic levels 38,2%, 50%, 61,8%, and modern means of a technical analysis will execute creations automatically.
In general, it is supposed that having made a start from the line of a Fan 38,2%, the price shall be turned and continue to move in the direction of the main trend. It will also report about a strong trend. Nevertheless, the probability of a contact the line of 50% by the price is high and only then correction can be considered finished, but in that case, it is considered that the main tendency weakens.
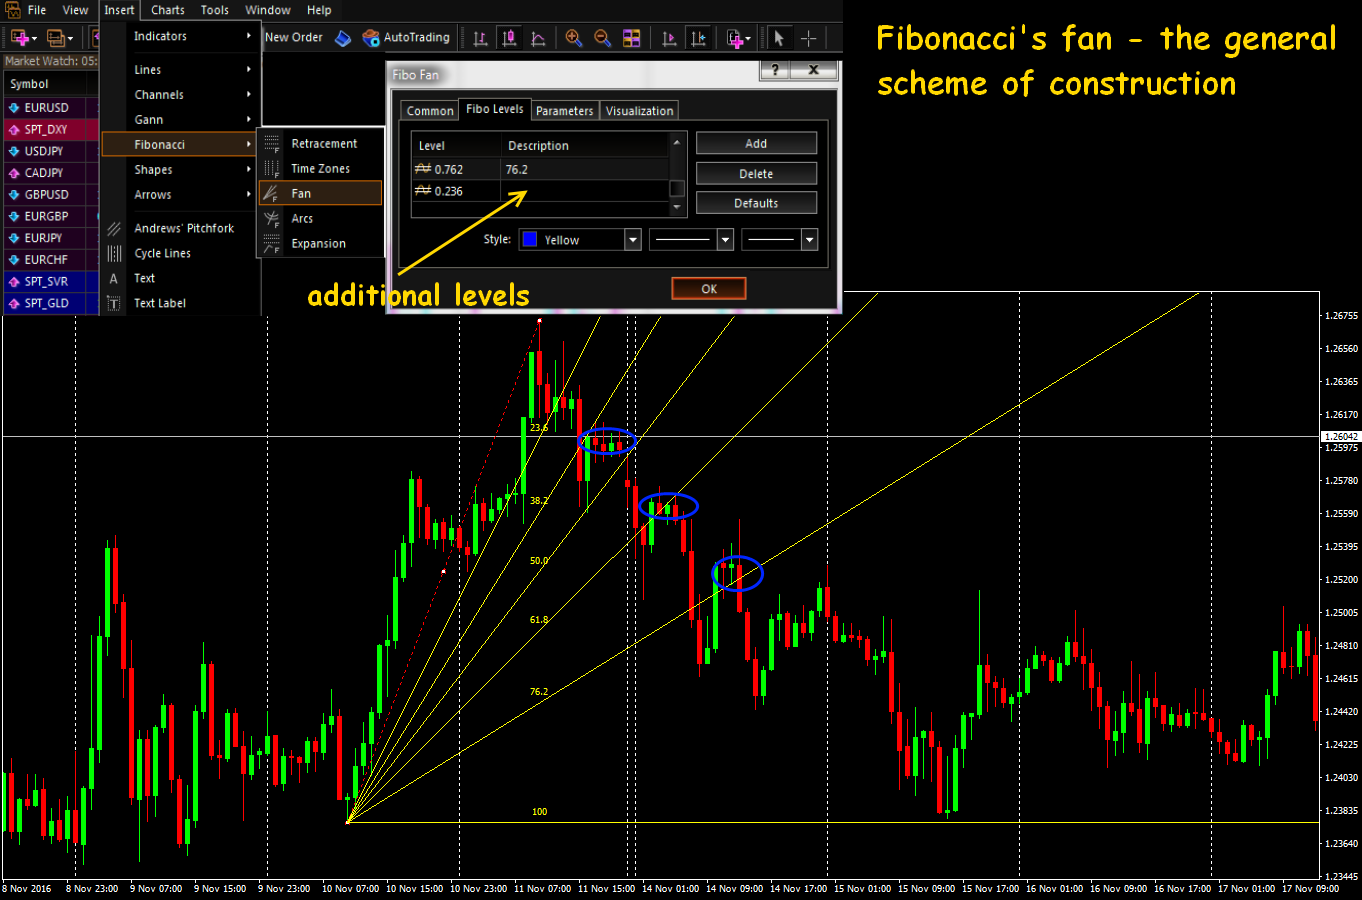
The depth of correction helps to estimate the force of the current trend. Fixing of the price to a beam 61,8% gives a reason to consider everything, that happens not as a temporary correction of the market and as a full change of a trend. Usually use, at least, 4 beams, adding after the level of the main correction (61,8%) as the additional filter the level 76,4% (0,764). The behavior of the price on this line allows deciding finally that there is − a correction or a turn. In practice breakthrough of a beam 76,4% means that with identification and an entrance on a turn were already late.
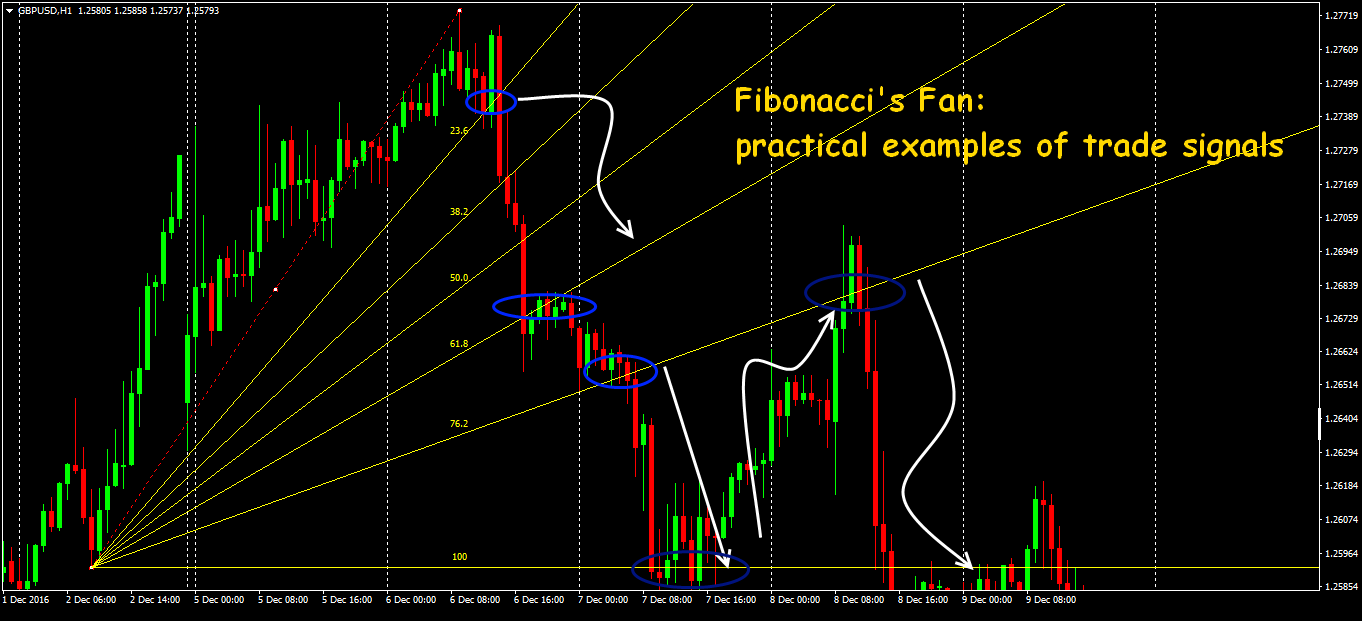
The correctional wave which reaches the level of 61,8% signals concerning essential weakening of a trend and high probability of change the direction, for instance, in case of a bull trend you may put the limit order for sale slightly below than the line of 61,8% with short StopLoss above the last maxima in the field of the zero Fibo`s line.
Nevertheless, direct use of a Fibonacci`s Fan for determination of points of kickbacks isn't recommended: there is always an error of creation of vectors of a Fan and subjectivity of an interpretation of signals. For an entrance, you should estimate price levels by means of technical tools of another type (for instance, amount).
Moreover, if the correctional wave breaks the levels of 23,6%, 38,2% and moves to a mark of 50%, signals of a direct Fan weaken, areas of kickbacks are already accurately not visible, and the creation of an additional correctional Fibonacci`s Fan on the site of the deepest correction is recommended.
If, as a result of correction, the price crossed all levels of a Fan and nevertheless was turned towards a trend, and if at the same time the new local extremum is formed, then in this situation we build Fibonacci's Fan again or we adjust to a new point of a local extremum. Fibonacci's Fan is practically not used without other tools and the thorough fundamental analysis.
Gann's Fan
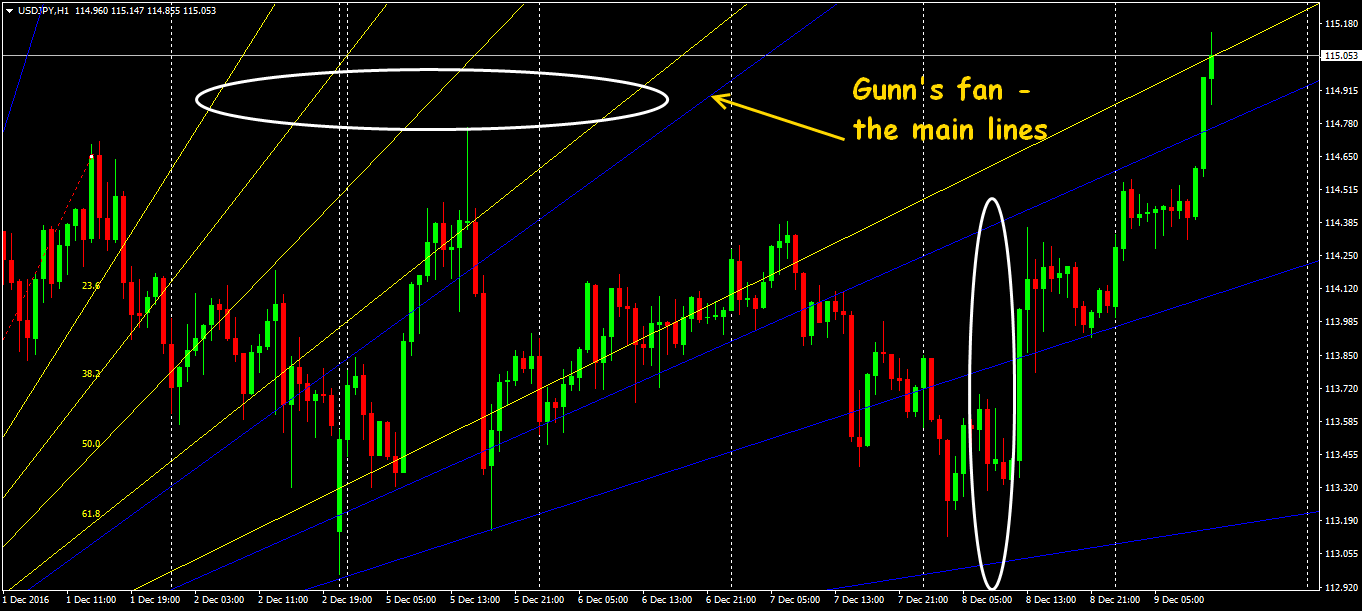
Lines of the Gann`s Fan are also creating under various corners − to the basic line «one to one» (Gann's line) which determines a current status of the market: the price location over this line is a sign of the growing market, below it – descending. This line is a certain theoretical balance between a time span and price range. The vertical and horizontal axes shall have an identical scale for making the inclination of the Gann`s line close as possible to 45°. A price exit above/below the line 1х1 is witnessed high probability of a turn, and further the price, according to the theory, shall reach the following trend line. That is, if one of the beams of Gann`s Fan is broken, you should wait for consolidation of the price near the following beam.
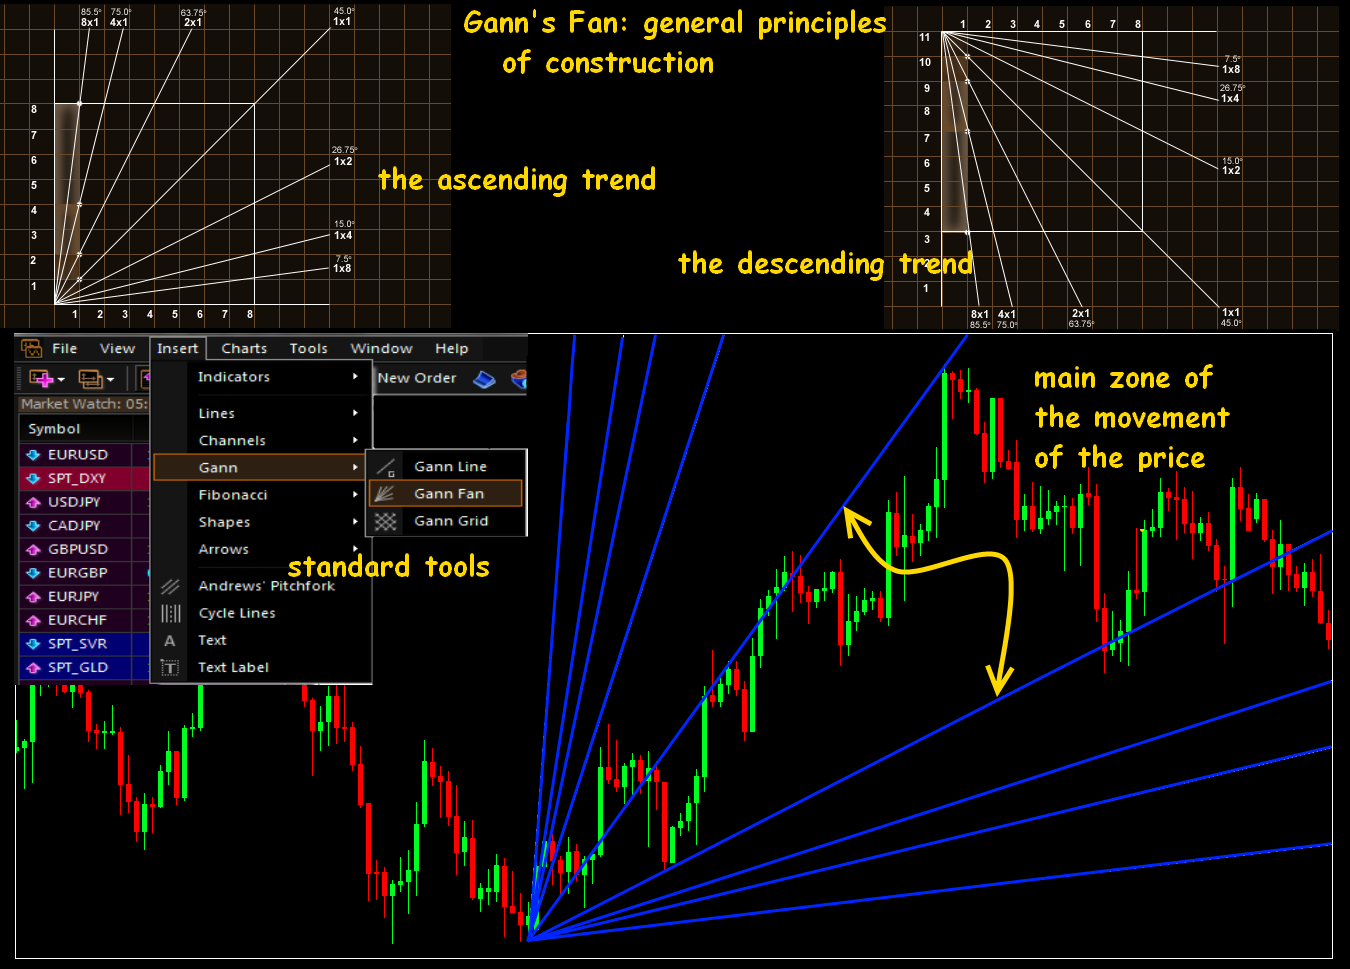
The simplified sense of Gann`s corner is the approaches to determining the amplitude of movement of the price in case of movement of the price in the direction of the main trend. The central part of a Fan determines the urgent range of support/resistance. Eight main corners determine additional power lines depending on the direction of movement of the price.
In trade Gann paid much attention to corners, he considered that the tilt angle of the schedule plays special value in case of determination of potential of the created tendency. In Gann's Fan tilt angles are set in the range from 7,5ᵒ (8:1) to 82,5ᵒ (1:8), as a rule, the price stops on one of these lines.
If to follow author's recommendations, then to pay attention is up to standard only on behavior of the price of the constructed levels. For example, if the price punched the line 1:1 (45ᵒ) from below-up, then the following consolidation and a turn are possible only at the level of 2:1 (26,25ᵒ). Practice shows that the price in 99,9% a case doesn't go beyond the constructed Fan, but, as well as in a case with one line of Gann, it is recommended to use a fan in trade with confirmation of the received signals.
The Fan will allow estimating the time of a profitable entrance and exit because the calculation of the Gann`s line includes coordinates of reference points at the price, scale and a time scale. The tool which is built in MetaTrader 4(5) is the option of a dynamic Gann`s Fan which is constructed similarly to Fibonacci's Fan − on two extreme points.
Correctly constructed Gann's Fan, for instance, on H1 (within a day) on Friday, will be urgent within at least next week if fundamental factors, of course, don't prevent. Gann's Fan allows estimating an arrangement of levels of support/resistance in each point of a price chart that is especially useful, for example, for a swing-trade.
The main problem of the Gann`s Fan, as well as all author`s theory - in the accuracy of creations. Despite various versions of indicators (except standard in the terminal), the error in case of automatic creation is rather high, and it`s quite difficult to build manually.
Most of traders consider that Gann's Fan behaves incorrectly in case of intraday trade. It is connected with the fact that William Delbert Gunn developed the technique not for trade in currency pairs, and for speculative operations with stocks. He chose those securities which had accurate annual recurrence. But it doesn't mean that its technique isn't suitable for trade in the foreign exchange market.
Base of its theory is the idea that the price and time are equivalent, and when using a day timeframe 1 day is considered evivalentny 1ᵒ, as a result year is considered completion of a cycle. It is convenient for calculation and not practically doesn't distort the creations executed on the big periods. With reduction of a timeframe the probability of mistakes in forecasts increases.
Joint use of two types of Fibonacci’s Fan and Gann’s Fan constructions, in general, provides emergence of additional power levels in critical zones that allows controlling the current situation better.

Application of Fibonacci`s techniques for the time estimation
Fibo + Fibo
It is logical to use Fibonacci's Fan as a set with price levels. Standard Fibo`s lines don't consider a time factor in any way and only warn about the strong price level and possible movement near it. Practice shows the combination of the Fibo`s Fan to the similar lines built on one base allows receiving some «key» points located on the next time frame on the crossing of lines. Having built the vertical line in such point, we receive future time parameters (date; time).
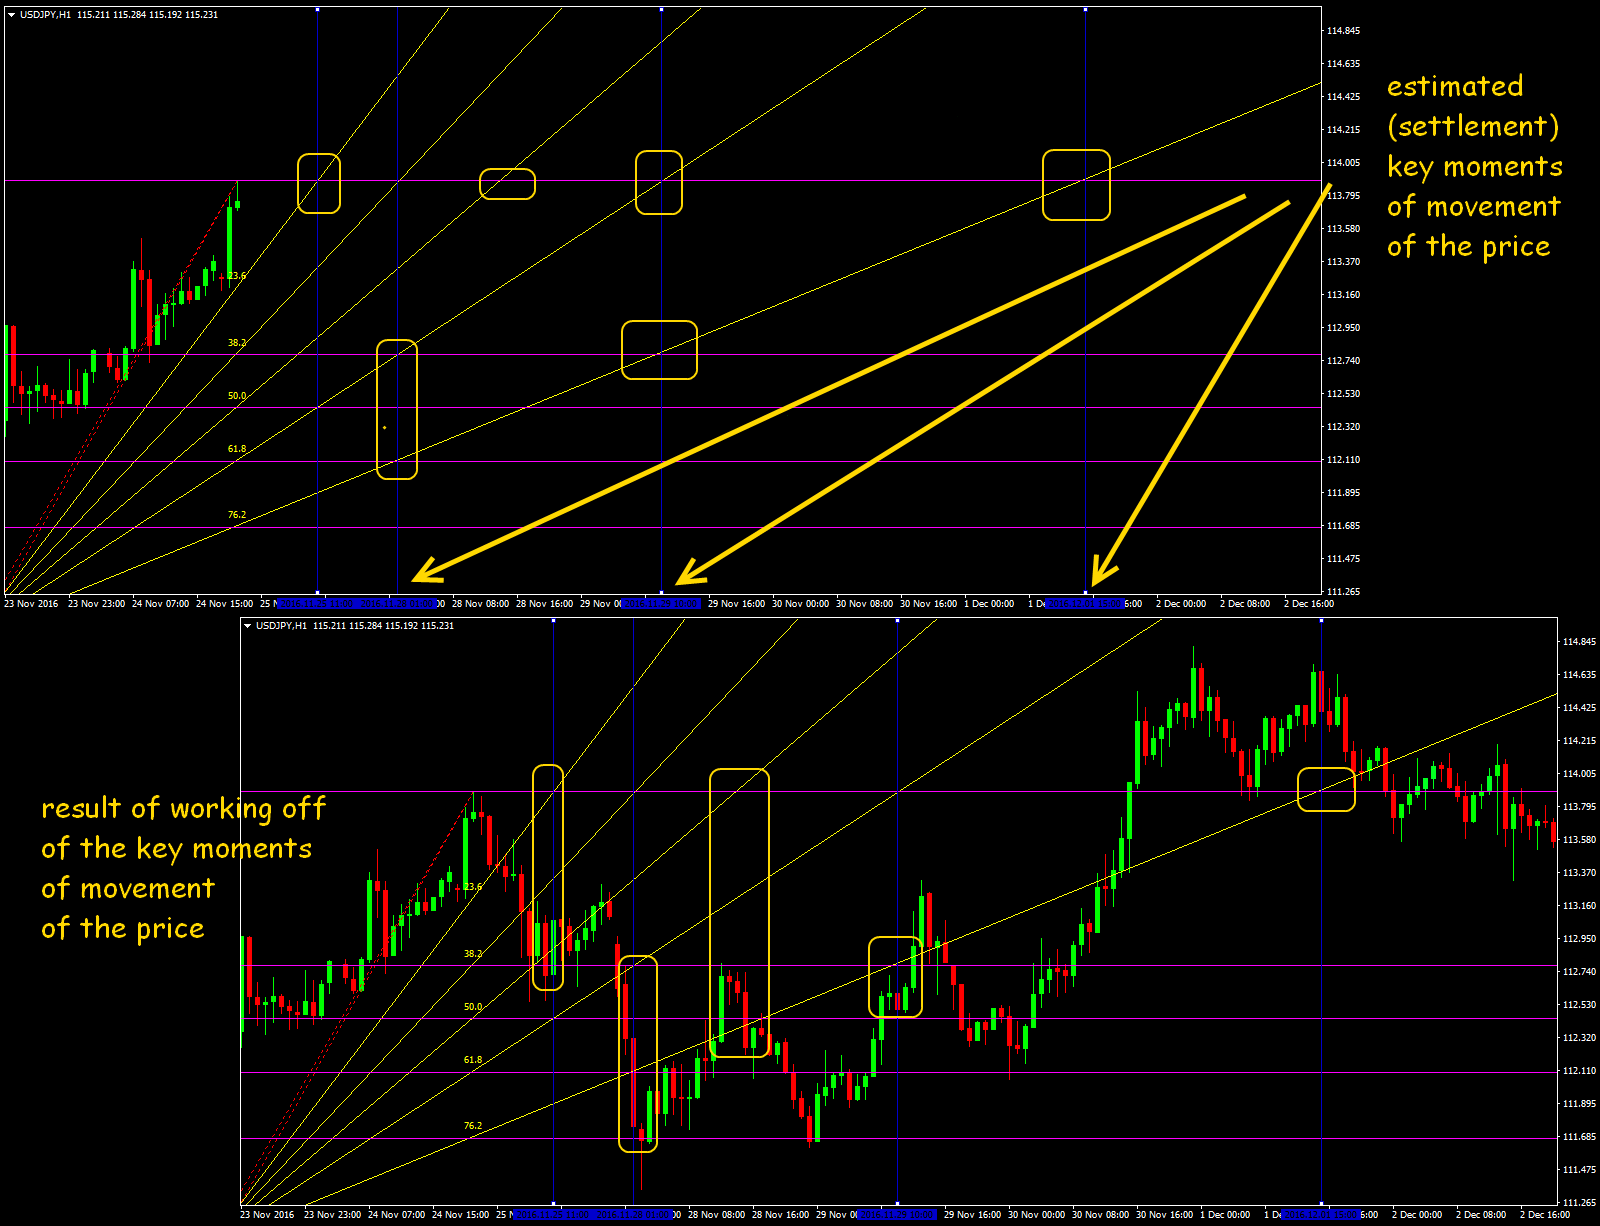
In the case of correct creations on the periods from H1 above such moments are practically always fulfilled. It is possible to assume at this time the market will make some decision – it doesn't say at all about what will occur, but it is possible to concentrate at least on the market before such moments.
If until this time there are no strong speculative movements (that is all Fibo`s relations remain!), then with the greatest probability the classical technical scenario will be executed after 1-3 candles. Such signals have special value for confirmation of the forthcoming turn.
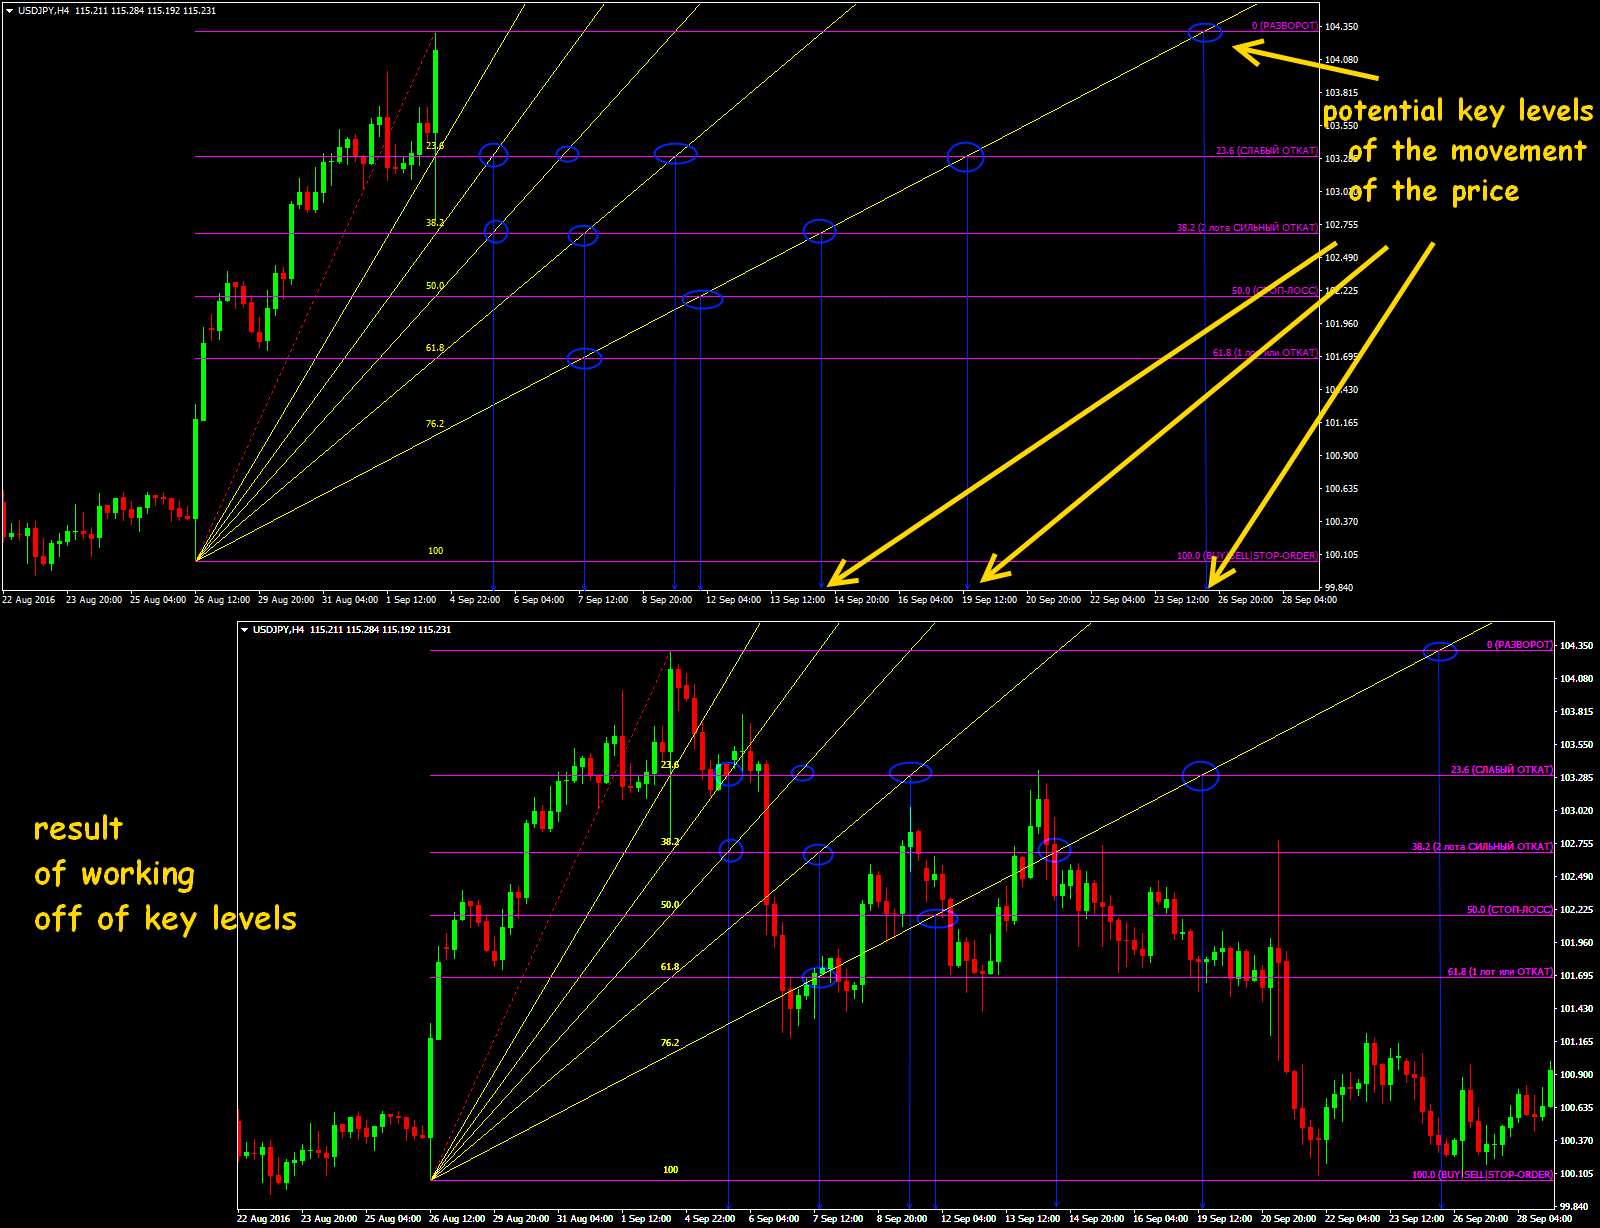
Gann's Fan + Fibo's Levels
The similar scheme rather reliably works also in the case of Gann's Fan especially as on Gann's lines such key points advance the fact of the fulfillment of a signal at least by 2 candles – this time quite enough to react correctly.
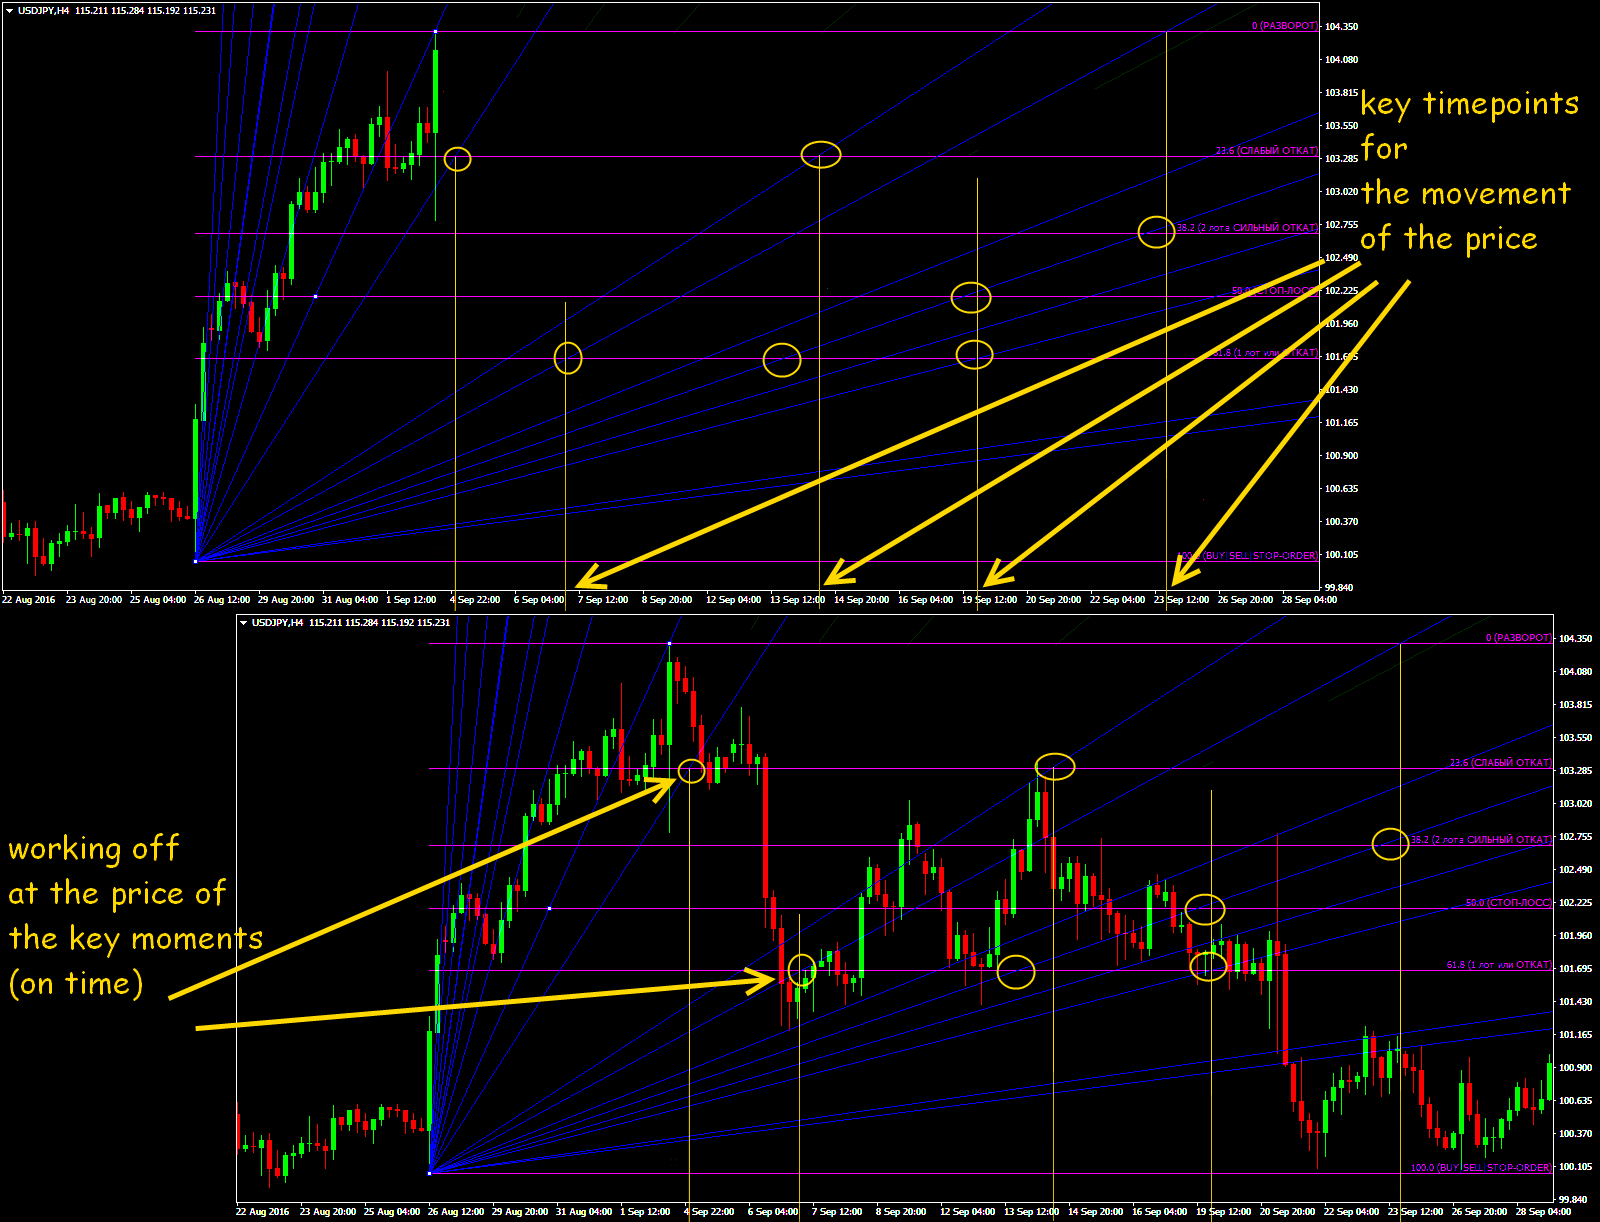
You shouldn't forget in such time analysis the error constitutes 1-2 candles to/after a point of intersection, that is 1-2 periods of the schedule.
Two Gann`s Fans or price zones
In the case of rather deep correction it is recommended to build an additional Gann`s Fan in the direction opposite to the current trend, then the price field is divided into the certain «price zones» and «dead zones» − with a various probability of price movement. The sites limited to lines of both constructions are considered as the most probable. Approximately so:
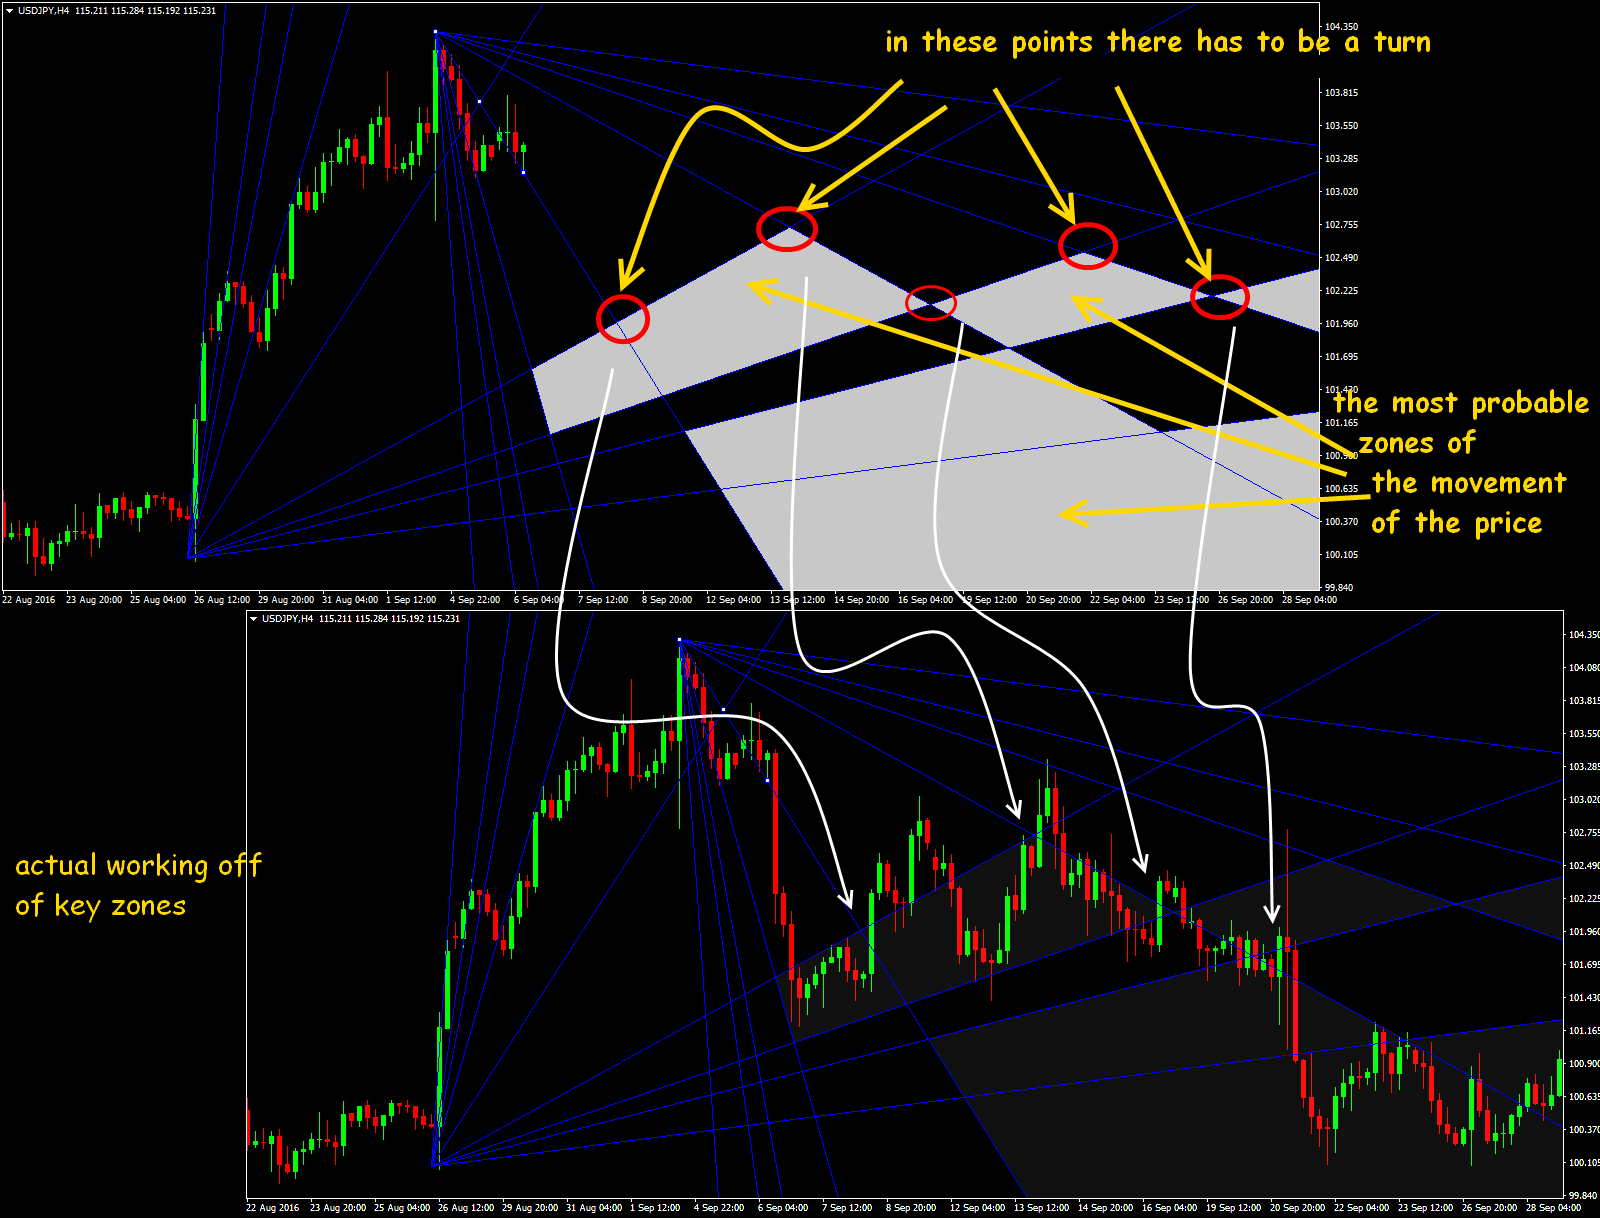
The probability of hit of the price in the specified «zone», fulfillment of key points and price levels is very high.
Fibonacci`s time zones
This technical tool is included in the standard set of any trading platform but is used extremely seldom just because gives quite disputable signals. The technique of creation is similar to a Fan: we choose some time frame as basic – from the initial point of a trend line (date/value of a price scale – the line 0) to final (line 1) – and further time frames, which duration corresponds to Fibo`s number sequence: 1, 2, 3, 5, 8, 13, 21, 34 and further, are noted by vertical lines. It is supposed that further, all considerable changes in price will be within easy reach to these time lines.
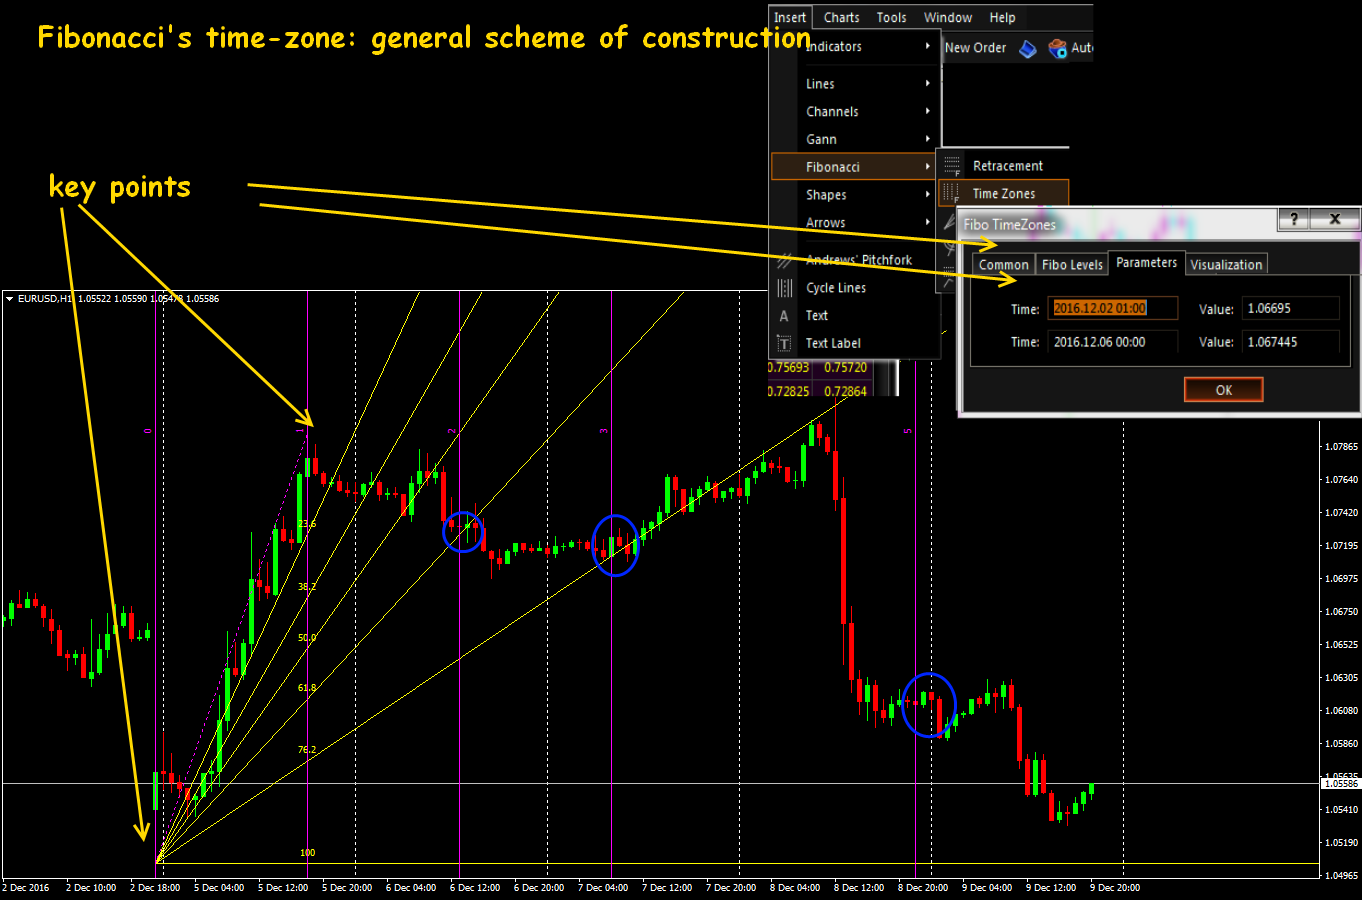
You should understand that calculations for this indicator are fulfilled in the dimension of the chosen time frame, that is the more the periods (candles) joins in a single interval, the general «scope» of creations becomes more. The built lines will occur «less often» in the path of the price, but the more a distance between them, the statistical probability of their fulfillment will be higher − so, at least, this technique assumes. Sometimes is better to include fewer candles in an interval but to provide a more correct tilt angle of the basic line (approximately 45 °).
At the same time reliability of the forecast in many respects depends on what movement was chosen as the basis. It is enough to choose wrong (uncharacteristic) movement as the basis for time zones and the mistake will accumulate that, as a result, will show absolutely another allocation of vertical lines.
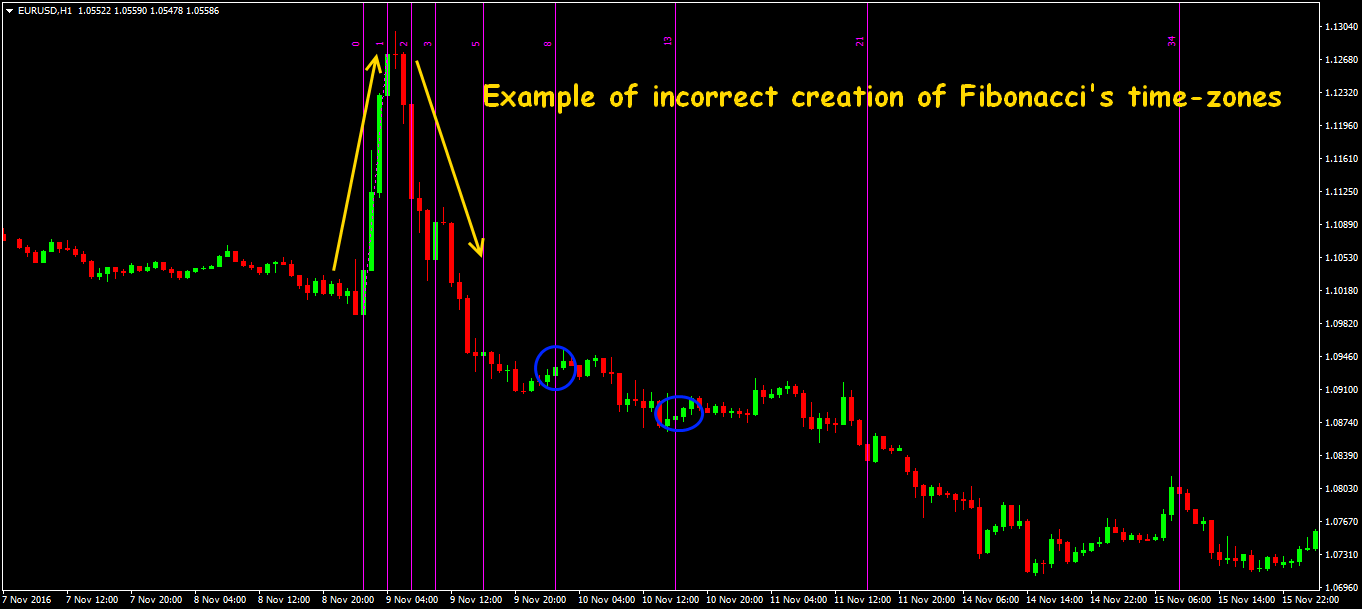
Creation of a time series on the speculative movement with fast consecutive kickback gives incorrect result – time lines are located too close and further constructions can not get for the moments of really strong movement.
In addition, Fibonacci’s Fan and Gann’s Fan of this method use the so-called «principle of accumulation»: apply several Fibonacci`s time series on one schedule (usually from different time frame), and then pay special attention to ranges where several settlement vertical lines are placed. You should wait for either speculative activity, or a turn within this period – it is already estimated on additional signals.
Several practical examples
In the case of rather empirical approach to calculations, actually, there are no obvious reasons not to trust such techniques. In the case of analysis of any time elements (lines, points, zones) the stable behavior of the price should be regarded as a continuation of the current tendency. On the other hand, any obvious discrepancy of time tags and behavior of the price needs to be treated as the probability of any serious change.
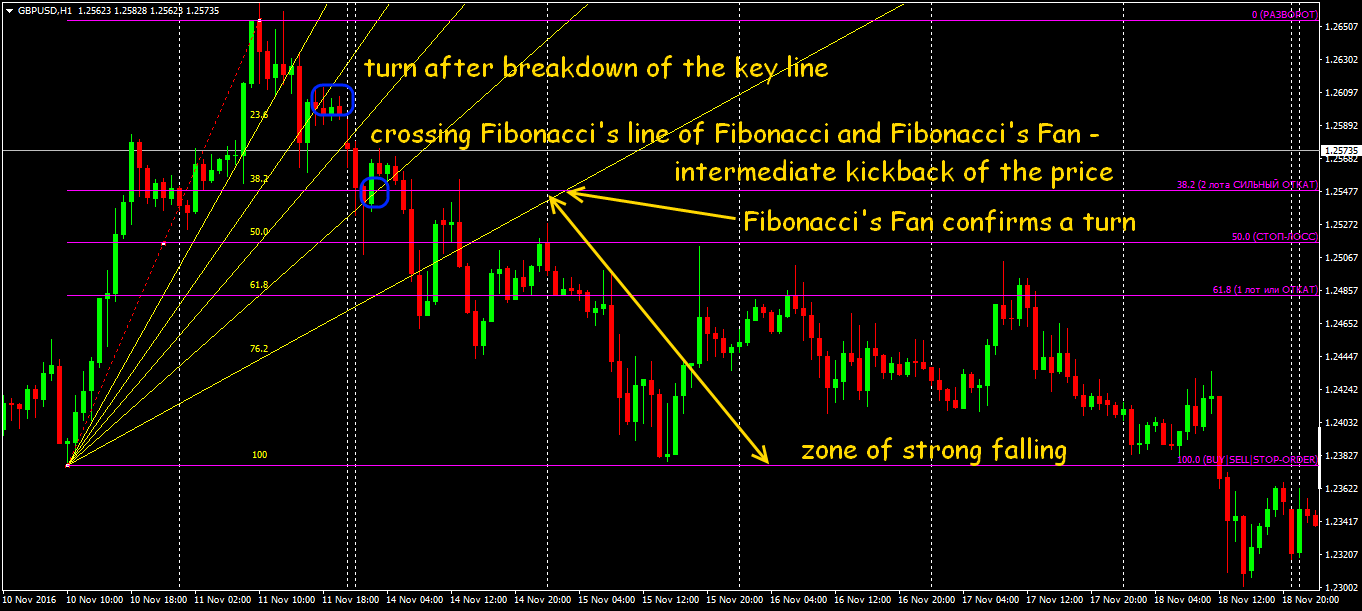
If the trade asset is rather volatile even in the case of a stable market situation as, for instance, GBP/USD, then, as a rule, time points «are late» to the fact of strong movements, especially when using the Fibonacci`s Fan. In the case of a breakthrough of strong price levels, the availability of such point will confirm the current trading signal (a turn or continuation). Besides, Fibo's Fan has quite wide «empty» zone from 76,4% to 100% in which in the case of a strongly expressed trend there are no time signals.
In the case of common usage above Gann's line the stronger time signals are given by Fibonacci's Fan, and below the single line − Gann's Fan.
All time calculations make a sense only in situations of the obviously expressed trend. If there is a flat on a current period (even if rather wide), then you should pass to a bigger time frame for the creation of any Fan.
The 45° tilt angle of the Gann`s basic line is possible only in the theory, but its value can be adjusted manually by the scale parameter in case of creation of a Fan. However, too big or too small value will strongly distort the time forecast and is much stronger than price.
We don't forget that this «scale» is measured in regular price points, therefore, it will be logical to choose it in accordance with average volatility in this period on the basis of data, at least, for the last 3-6 months – it will help to consider correctly all freshest «non-standard» throws of the price.
Strong movements (like recent on the pound in connection with Brexit) break any statistical forecasts and it`s possible to trust to the time signals only after compensation by the market of such movement, at least, for 60-70%. In that case, you may try to replace Fibo's levels with Murray's levels and to track their points of intersection with lines of a standard Fan as Murray's levels are quicker reconstructed in the new price range.
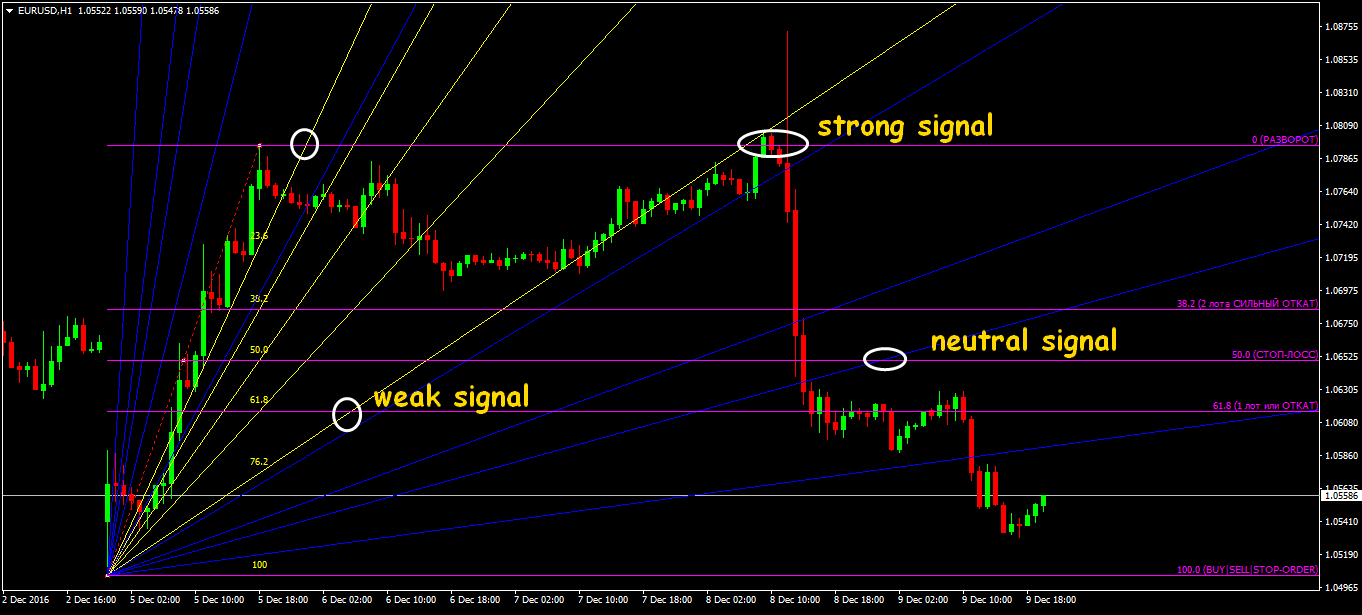
The constructed Fibonacci’s Fan and Gann’s Fan always has the whole set of key points, but all of them have different statistical value. Theoretically, the price levels in a point of intersection are stronger, the movement of the price at this «future» moment is more probable. How strong this signal will appear − in real price points − will be determined by future trade conditions (amounts, the base, the current correlations). On an example lower you may assume in advance the strong movement from a point of intersection of the Fibo`s Fan line with the most top turning level of the grid of the same name, but its absolute value could be within regular daily average volatility if this time point didn't match strong fundamental factors, for instance, news release time.
And as the conclusion …
Everything concerning time forecasts is always approximately and unreliably. The recommendations stated above don't apply for tough rules at all and can be applied only as some elements of full strategy. Such methods are useful only in situations when the market is rather technical and fulfillment of standard graphical figures or price levels is expected, besides, in such cases the additional information about the current amounts is necessary. In the case of analysis of the received time points, the fundamental analysis has to be made.
Of course, any time as well as standard price calculation according to Fibonacci’s Fan and Gann’s Fan, makes a sense only on the time frames, which are not below M30-H1 and in case of obligatory estimation of current (and whenever possible − and future) fundamental situation (news, statistics, opening/closing of sessions, trade week). On smaller periods the similar time forecast doesn't make a sense at all.
Don't forget: after any speculative movements even if the general trend doesn't break visually, the current extrema, slightly, but change. For this reason, the offered graphical creations for the time forecast are recommended to be adjusted. If the main (horizontal) price levels usually remain, then the shift of lines of a Fan even on 5-10 points can significantly displace settlement time points so any attempts of placement of the postponed orders for opening on such «key» time including by advisers aren't recommended. Meanwhile, the stable technology of the time forecast is not discovered and it isn't possible to control time in the financial market, but the statistics which is saved up by Gann's techniq ue show quite good result. So those who try to optimize the expectations of the market – can try.
Social button for Joomla