

")

The sharp price impulse means that the new market players appeared and made a decision moving market balance towards the purchase/sale. Forex breakout strategies shall estimate how «genuine» and long will be a trading signal so that the small market player could enter the market in the direction of large volumes − and to grasp the profit share from a new trend.
The main thing in these trade techniques is a proper analysis of volumes and behaviour of the price which is close to the critical price levels. Even though the trading signal on an entrance normally comes latein case of the sharp breakdown, it does not prevent the experienced trader to use strong movements by using some means, both for speculative profit, and for trend trade. Any technical or fundamental factors can also serve as the catalyst of this movement.
Forex breakout strategies are considered as a classics of the stock exchange trading and continue to prove the efficiency in any market. Their main idea is in that the market moves from one point of market balance to another. If the asset price long time cannot derate, then the market constantly accumulates «trade interest», and, so there shall be a break in a certain direction as result of the market decision. The fixed imbalance between purchase/sale leads to expansion of the trade range, and in search of a new point of balance quite good opportunities for trade appear. We will consider the main types of strategy below.
What is «true» breakout
Any situation of breakdown means market reaction of players with obvious interest in purchase or in sale. Breakdown gives the trade signal allowing to enter the market in the direction of large volumes together with strong players. And if it is correct to make everything, then a part of profit from a strong trend it will be obligatory yours.
Classical definition is the following: breakout is a crossing of the strong price level (support/resistance, borders of the channel, extreme values) after which the price will more likely move in the direction of the breakout, than will return back. For breakout in the market there shall be something serious to shift the price for serious distance.
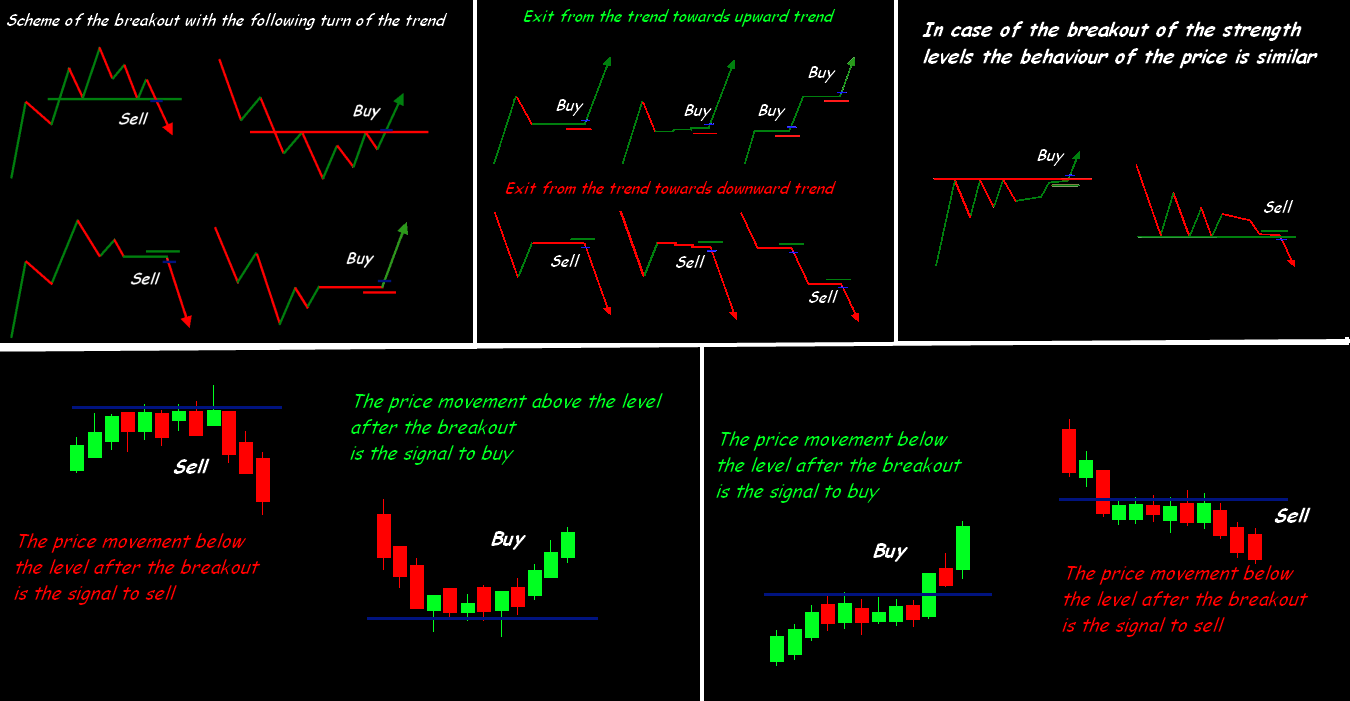
It turns out that if the price approaches power levels, then two scenarios of behavior are possible:
- a release from the power level or a turn in the opposite direction;
- «true» breakout of the price is fixed beyond the level and continues to move in the direction of breakout.
The more abortive attempts of breakout occur («test») including «false» breakouts, the steadier and the more significant is the specific price level, and the bigger market effort will be required for its real overcoming. Reliable breakdown requires at least 2-3 tests on the period from H1 above, and then the more visible are kickbacks, the strong is the movement towards a new movement.
In the most standard options Forex breakout strategies encompass two trade tactics for opening of positions:
- on a «true» breakout – when the price is attached to certain levels the entrance is carried out in the direction of new movement through the market order or installation of the postponed order, for the purchase − higher than the level of possible breakout, for sale –lower than the level;
- an entrance on a final point of kickback (on the second kickback − at least!) in the direction of possible breakdown, as a rule, through the market order.
Closing of positions is carried out traditionally – on stops, trailing stop or by more tough rules of a money management because the volumes which caused breakdown completely have not been worked out, there is a high probability of the fast kickback. Main types of breakout are shown in the graphs below, breakout after movement near the key level (called as a BASE) received the name of «Gerchik’s breakout».
The characteristics of a «true» breakout:
- Closing of a breakout candle behind a price barrier (as it is possible further), especially strong is a situation when min/max candles also are behind level borders.
- The distance of closing of a candle from key level shall be more than the range of average volatility for 5-7 and more periods.
- If the price keeps behind key level within 3 and more temporary periods, then it is possible to consider that the breakdown proved to be true. For intraday and medium-term day trade by a control time span is the period usually of 2-3 hours.
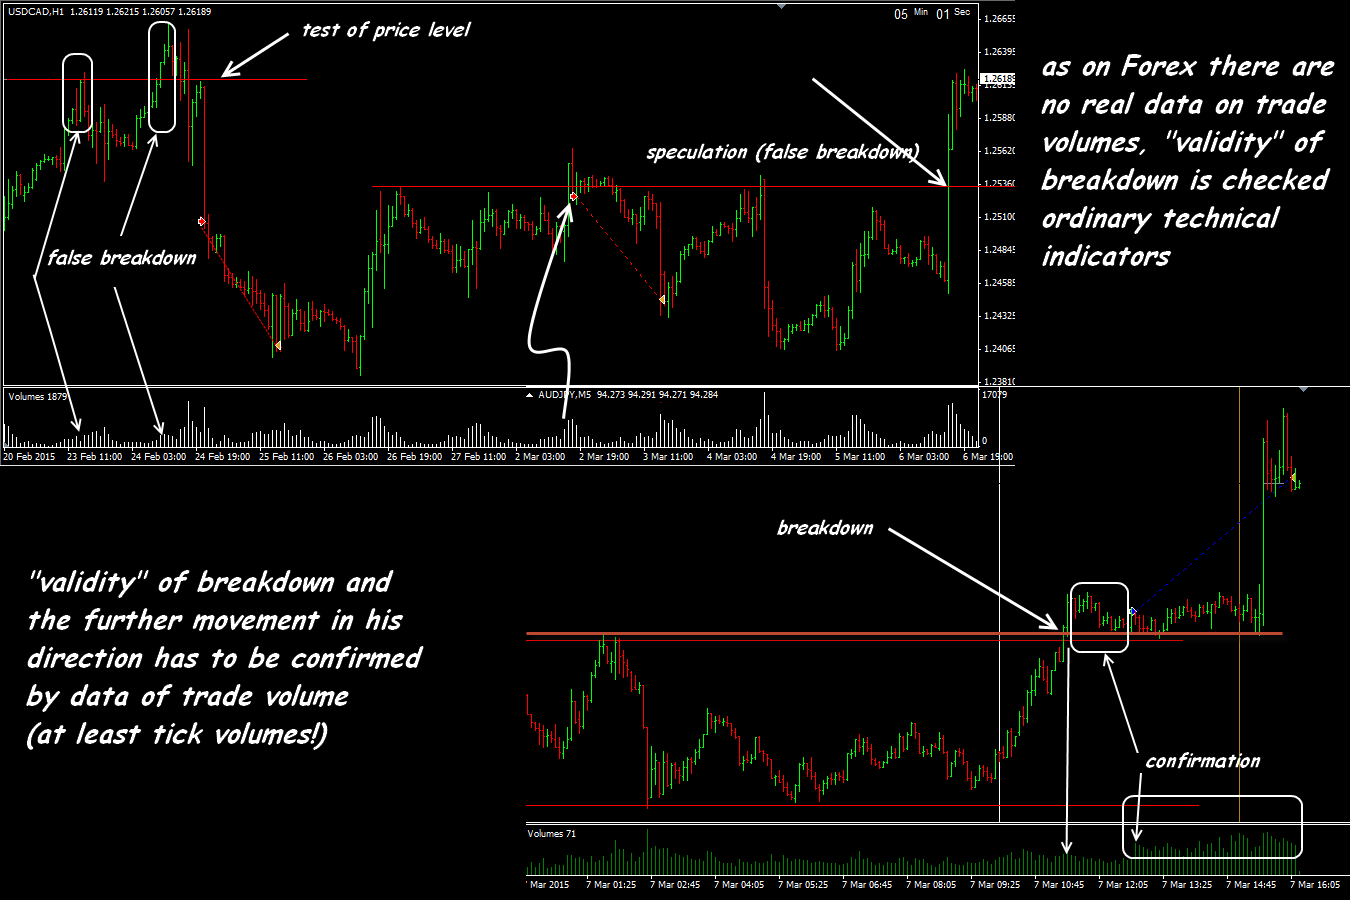
- It is necessary to watch volumes, which accompanied movement of the price to, at the moment and after breakout. If breakout is not confirmed by splash in volumes, it means that it is just a current speculation and if you did not manage to open correctly in the direction of possible breakout, it is dangerous to enter based on the market, it is necessary to wait for closing of the current candle.
What is a «false» breakout and as «to see» it
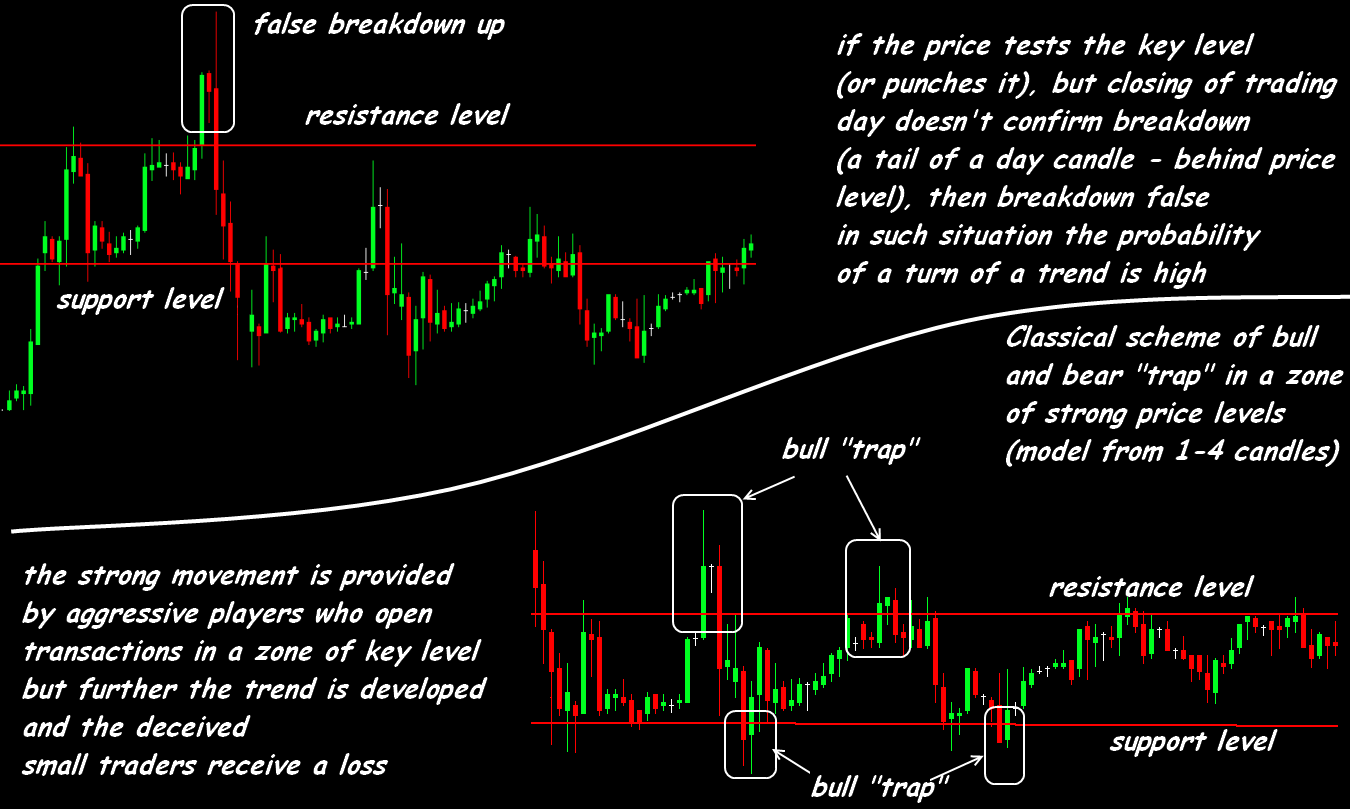
Technically breakout is considered «false» if it is a breakout at the price of some key level with subsequent fast (1-2 candles) turn in the opposite direction. As a result of the incorrect analysis, the trader opens the transaction towards breakout, but at the expense of a fast turn incurs the same fast losses.
The concept of the «false» breakout is directly connected with market psychology. This is a manifestation of a «gregarious» reflex in the market when the small players try to be in time on the leaving movement without serious analysis. As a result it turns out that they try to purchase at tops and to sell on minimum. «False» breakout is a market «trick», testing and collection of stops near the strong level. Therefore emergence of several «false» breakouts can be treated as the strong warning of the forthcoming direction of the market if the market players think in the direction opposite to the movement of the crowd.
Main types of «false» breakouts
«False» tests of the key levels begin to create long-term trends of the market. While creating strong levels of support/resistance, turning levels (Fibonacci, Murray) it is possible to draw to them the attention of small players and to wait for breakdown attempts to have an opportunity to trade against the «crowd».
Several criteria for filtering «false» breakouts:
- The main trend and key price levels are analysed on the timeframes, which are higher than for an entrance (from H1 above). If the medium-term trend remains, and on the small period breakdown attempts are visible, then the probability of regular speculation on purpose just is high «to gobble up» market plankton which constantly opens positions at the end of strong movement. The larger is the analysis period,the more reliable is the breakout.
- If the direction on a middle term and the direction of the current attempt of breakout are identical, then the chances of the «validity» of breakouts are much bigger.
- Except the moment of breakout, it is necessary to analyse the candle patterns through which the breakout was performed. A «true» breakout is created by the candle with a big body and small shadows closed behind the key level. It means that the market uses the serious considerable efforts in the direction of breakout. The popular graphical patterns, such as «the Double Bottom», «Double top» or «Head Shoulders» usually have strong trade interest in the field of the necks line or the line of key points. For this reason the set of the «false» breakouts are caused by regular working off of stops according to orders of small customers. Thereafter the price comes back with the same speed.
- All Forex breakout strategies for confirmation of breakout require that the Close price of the day candle was below the breakout level (in case of fall) and above the breakout level (with a growth).
- If the price breaks the support level, but at the same time on the oscillator, for example, on MACD, bull divergence was created, then it is more likely a «false» break. Similarly, when the price breaks the resistance, and on the indicator of oscillator type there is bear divergence, then this break is not suitable for position opening.
Breakdown on a pattern of «PIN-bars»
If the breakdown was unsuccessful, then it is possible to earn on a kickback from strong level, but most of traders, being fond of the analysis of behaviour of the price in a breakout zone, do not notice the opportunities that give rise to forming of the well-known PIN-bar.
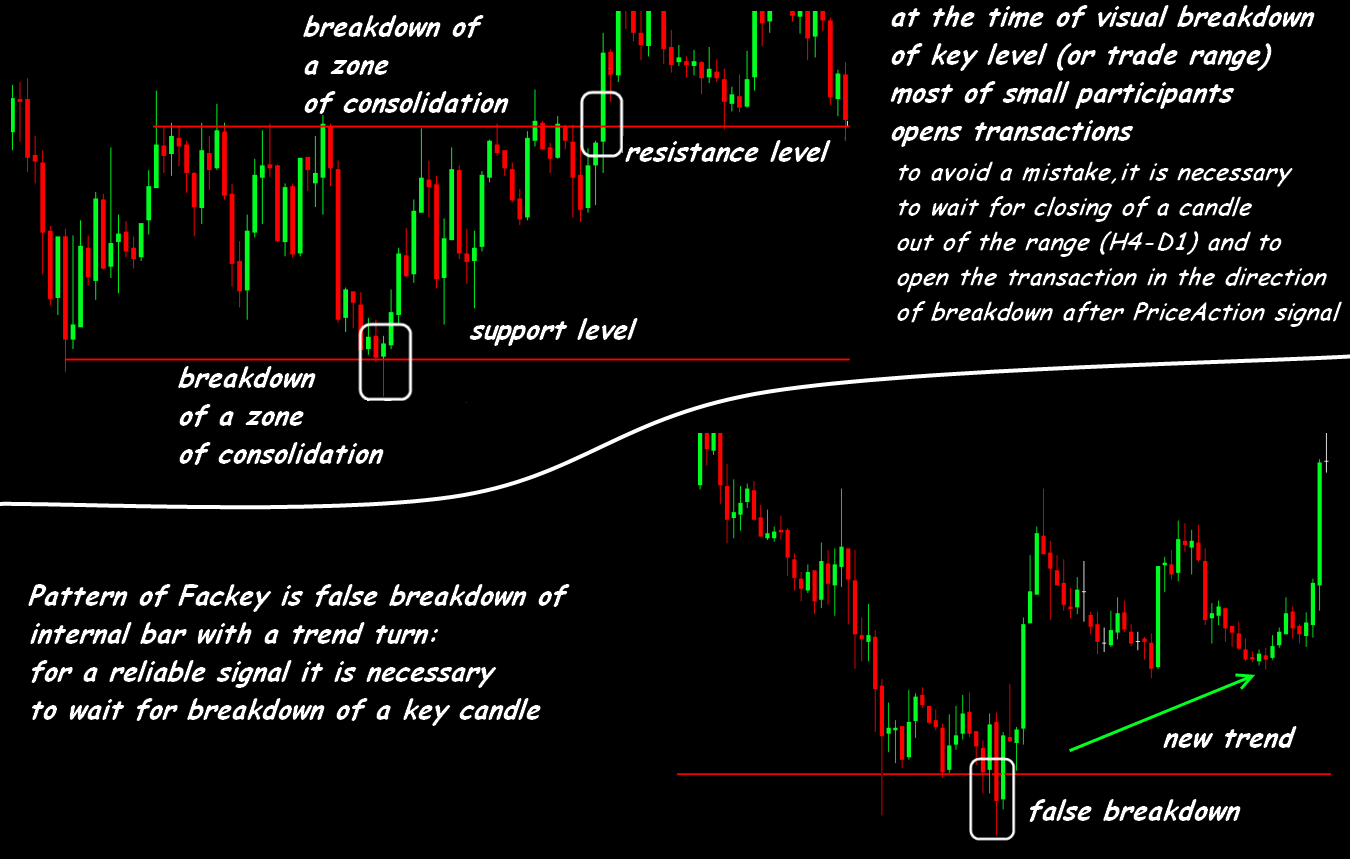
Pin Bar (or Pinocchio bar) is one of the strongest turning models on the periods from H1 and above. After the first side candle most of which often looks as breakout of the level the central candle with a short body and a long shadow, so-called «nose» is created. The longer is the nose, the stronger will be the expected turning movement. The general scheme of a pattern and a classical technique of its working off is set out below.
- a «body» of no more than 20% of the size of a long shadow or in general without it;
- a «nose» shall come to an end far beyond the border of the «eyes», and the body shall be at the level of «eyes» and close to the opposite end of bar («hammer» in case of bull trend and the «turned» hammer in case of a bear trend);
- the PIN-bar shall not be an internal bar;
- opening/closing of PIN-bar shall happen in the range of the «left» eye.
The PIN-bar shall be located for the subsequent successful working off:
- near support/resistance levels;
- strong day or week max/min;
- Fibonacci's levels;
- long moving averages;
- pivot point levels.
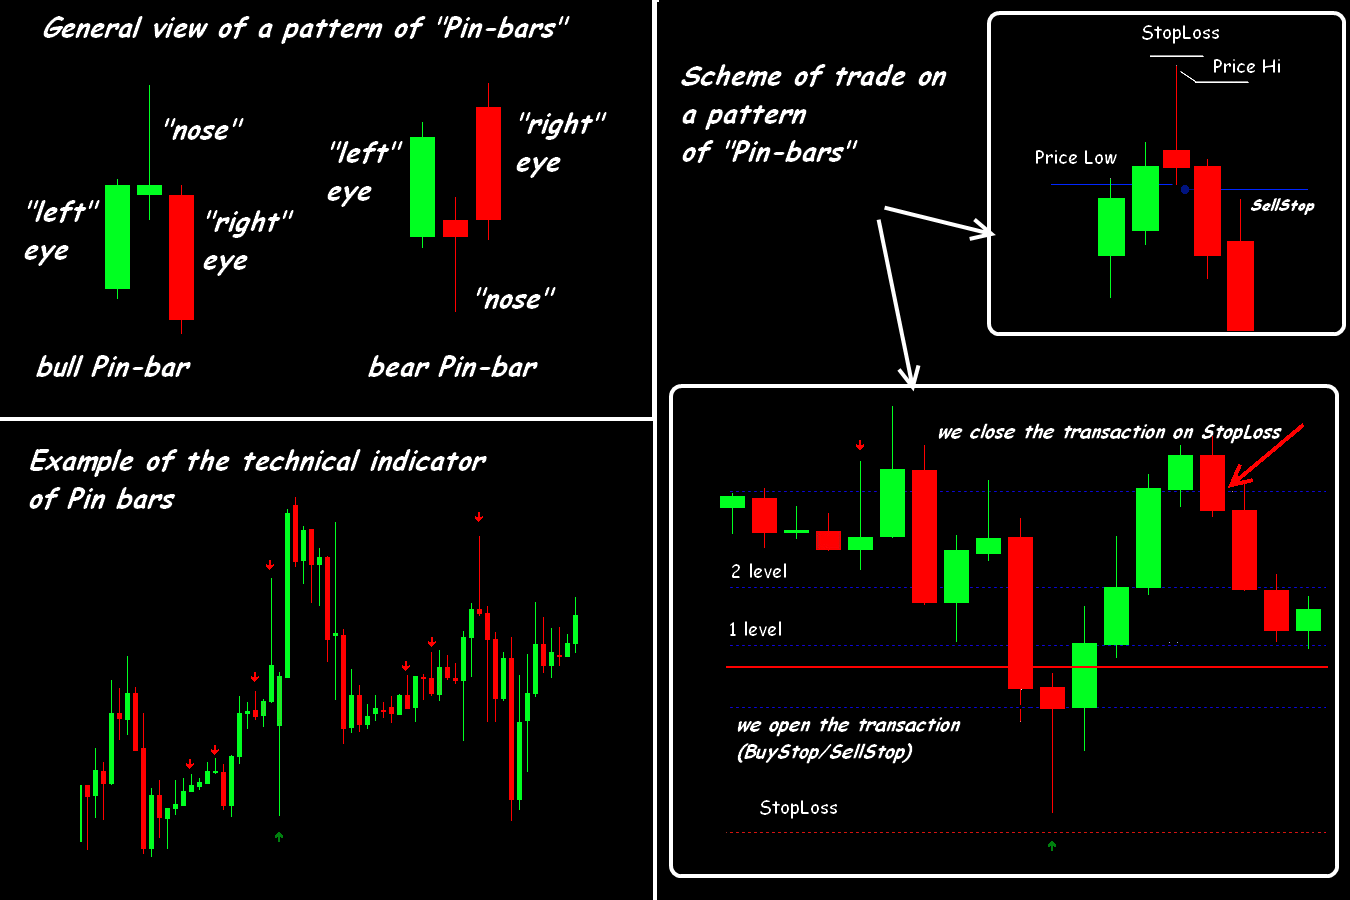
We open a position after closing of the «nose», best of all through the postponed BuyStop and SellStop ordersat max/min values of PIN-bar. The StopLoss level is within 3-5 points from a long shadow, a profit can be got by trailing or by partial position closing at the key levels of a pattern.
It is possible to use the special technical indicators for determination of the closest to an ideal (settings are configured!) and patterns, suitable for trade. After installation the Pinbar indicator automatically determines already created PIN-bars and highlights them by shooters of the corresponding colour and the direction.
Breakout strategy: main techniques
Classification of strategies is simple: breakout can be differentiated depending on a type of price level:
- support/resistance levels (including «round» levels);
- borders of channels (including dynamic);
- max/min levels;
- trend line;
- volatility levels.
Even the obvious fact of break of price level isn't a sufficient trading signal. Any type of breakout requires confirmation by other technical indicators and necessarily volume indicators.
It is always necessary to remember that in any breakout the speculative component is very high, and therefore all Forex breakout strategies, especially short-term options, impose strict requirements to a money management. Trade on breakout without installation of stop losses is strictly forbidden.
Real examples of breakout strategy can be found in network, let's not repeat, we will be limited only to short practical recommendations.
Techniques without indicators
Techniques without indicator are set up on the basis of the analysis of graphical patterns or price designs of Price Action. These techniques are popular among the beginners, but the correct identification of graphical figures requires considerable experience, and therefore use of such techniques is rather dangerous. Moreover, such strategies are not suitable for short-term trade.
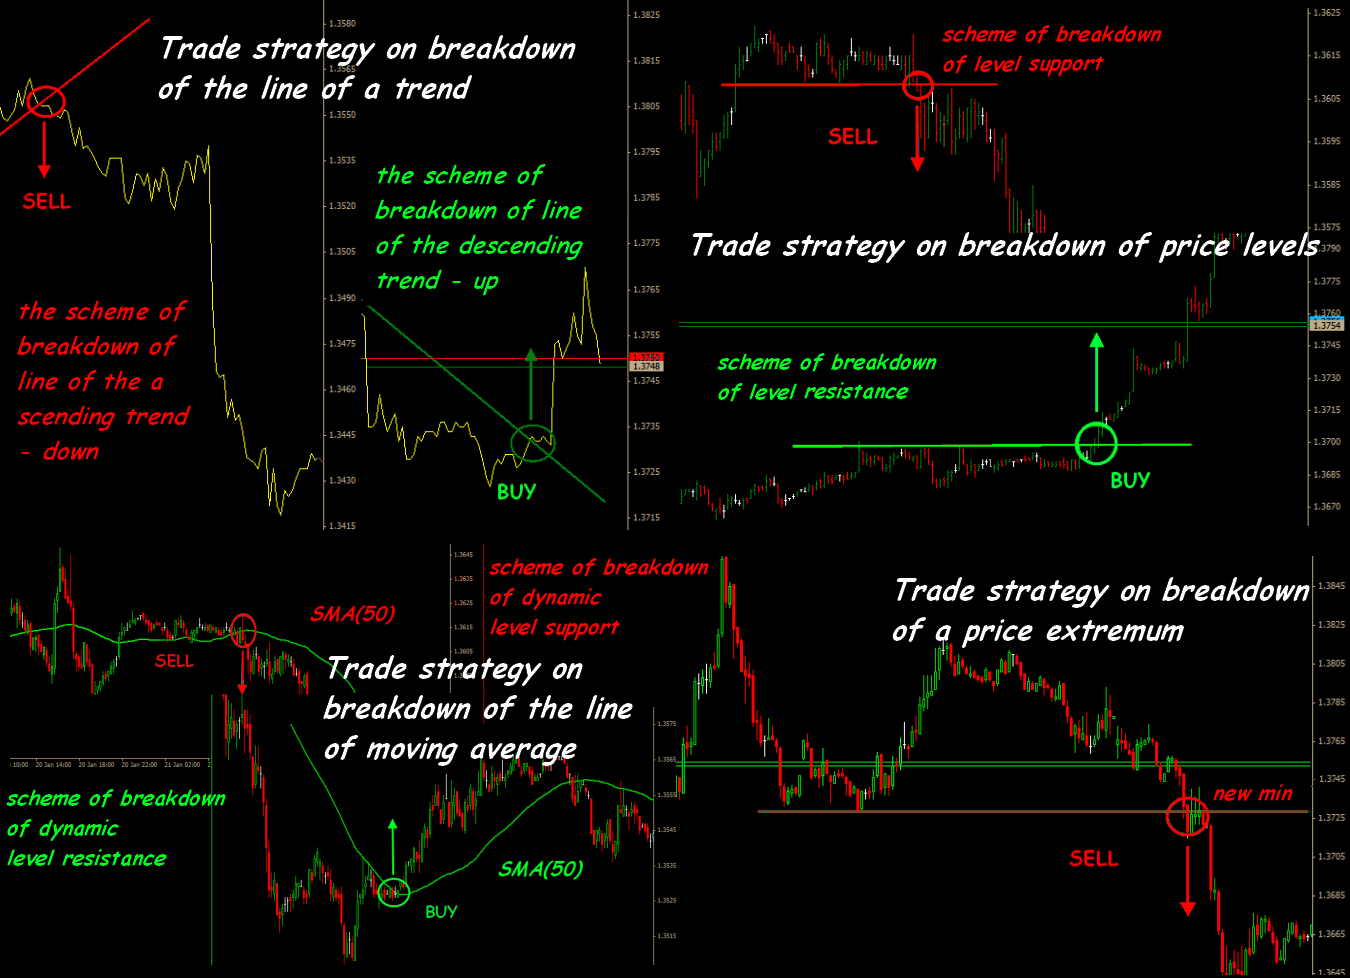
Technique on breakout of trend lines
Historically the oldest and stable system constructed on a simple logic: on a bull trend (the line on the ascending max) we look for breakout down, on bear trend (the line on the descending min) — breakout up. This technique works at a timeframe from H1 above and only at trend sites.
Breakout strategies on breakout of price levels
The strong trade impulse is usually caused either by an entrance of large players (for achievement of new price profitable levels to it) or accumulation of trade volumes at the key levels. Price levels (static or dynamic) always exist on any asset and on any period. If taking into account consider that real open interest and the postponed orders are constantly visible to marketmakers and large players, then such strategy is most often used in the speculative purposes.
Example of the medium-term trade strategy of RaminLines on breakdown of price levels
Trade asset: any currency pair. Timeframe: H1.
We open Buy if:
- the candle is closed above blue level;
- Stochastics is not in an oversold zone;
- StopLoss is behind the next lower red level;
- TakeProfit is lower than the next top red level.
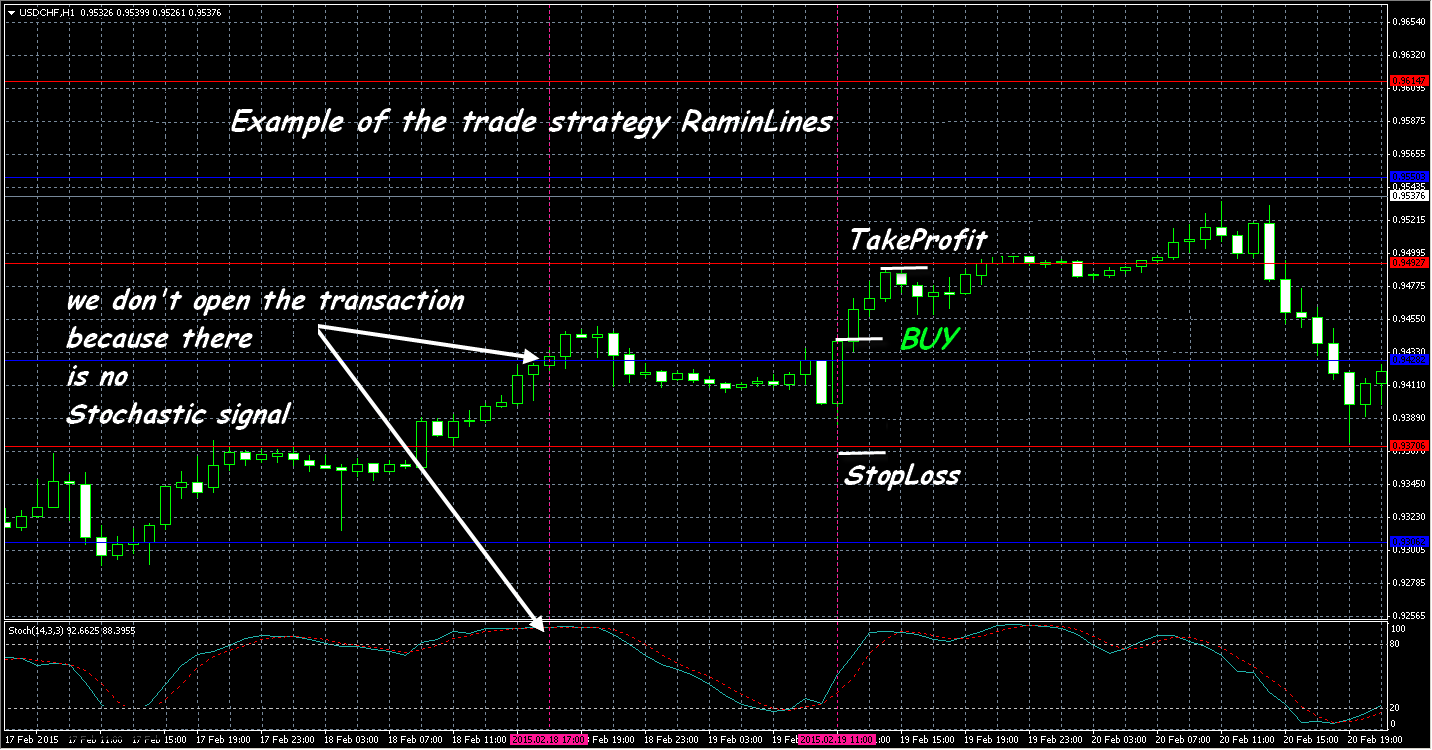
We open Sell if:
- the candle is closed below red level;
- Stochastics is not in an oversold zone;
- StopLoss is above the next blue level;
- TakeProfit is higher than the next top blue level.
Technique on breakout of moving averages
Classical moving averages of SMA and EMA with the strongest settlement periods (20,50,200) from the point of view of mathematics give to the breakout the additional force – the break and fixing of the price to these levels means an exit from the range – the strongest price levels, and their breakout means an exit from a zone of average value and forming of a new tendency.
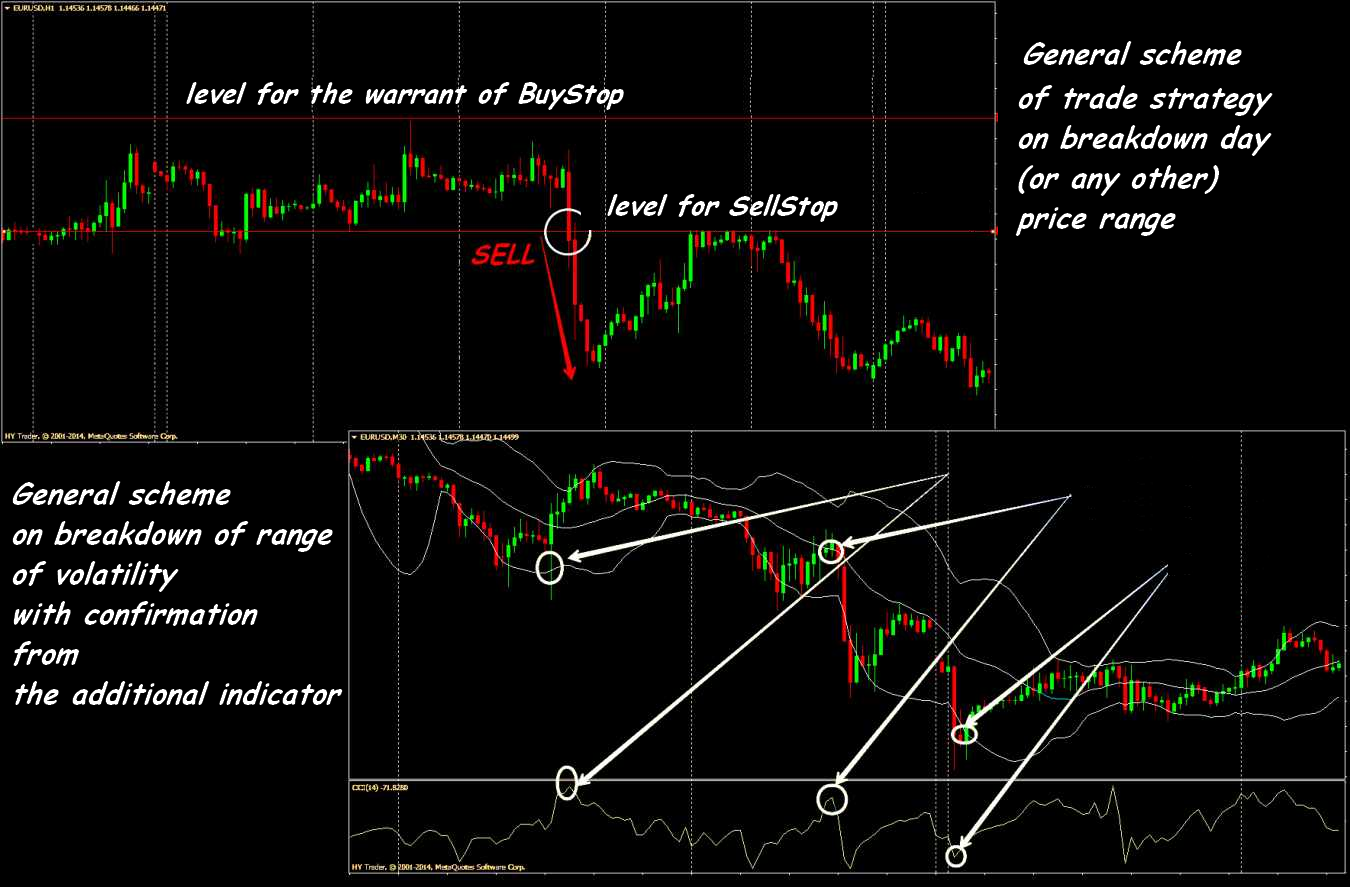
Example of trade strategy on breakout of the range
Classical set of the moving averages, with confirmation of a trading signal by means of a slow moving and the modified oscillator. Positions are open on a trend of the senior period.
Trade asset: high-volatile currency pairs. Timeframe: for an entrance – M1, for the analysis — M5. For trade the period with the greatest volatility on an asset is chosen.
We open Buy if
- the DSS indicator of momentum (an additional window) shows a pronounced bull trend;
- the price leaves out the limits of the upper bound of the channel of moving averages;
- the candle is closed above red moving average.
StopLoss is below the next local min.
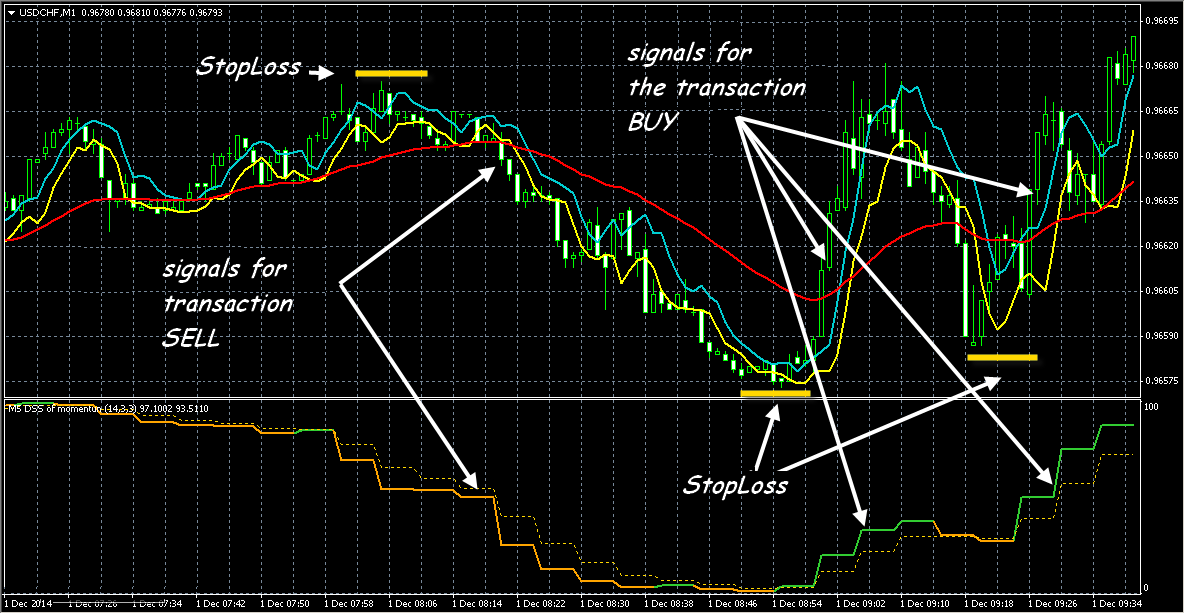
We open Sell if:
- the DSS indicator of momentum (an additional window) shows the pronounced descending trend;
- the price leaves out of limits of the lower bound of the channel of moving averages;
- the candle is closed below red moving average.
StopLoss is put slightly above the next local max.
Closing of the transaction: the fixed size of a profit or a trailing along red moving average.
Trade technique on a new MAX (purchase) and a new MIN (sale)
From the point of view of the technical analysis the most steady combinations of breakout of power levels and breakout of the price channel. Each extremum shows a new border: maximum price resistance level, minimum price and support level. Price levels are constantly recalculated depending on dynamics of a situation in the market. The postponed orders are usually used.
Technique on breakout of max and min of a previous period
The breakout of the day range is most often used (for example, Linda Rashke's strategy «80-20s»), but in principle it is possible to use any period above H1. The trade is done by two postponed orders: BuyStop is 10 points higher than the previous max (+10) and SellStop is 10 points lower than last min.
Technique on breakout of price channels
The best-known long-term breakout strategy of this kind is Richard Dennis Turtles which fulfills breakout of the 4 weeks channel.
Situations of breakdown of static or dynamic trend channels are most often worked out, but trade on a release in a wide flat can be effective (various versions of channels of Donchian – on extreme values, or Bollinger 's Strips on averages). The analysis of retest of borders of the channel on price history is applied as a check of «validity» of breakdown. The sliding stops on a on lines of borders are usually used for dynamic channels.
Technique on breakout of volatility
This is the one of the options of a swing trade based on the forecast of the future and rather short-term impulse is enough. Practice shows that if the market moves from the previous key level for some percent, the probability of movement in a selected destination increases. The indicator of volatility (ATR type) is needed. The higher is ATR indicator, the more probable is a close turn, the less its value, the trend is weaker and the market is quieter. The entrance to purchase is carried out in case of breakout of the line of the indicator in a zone of limiting border of volatility, and an entrance to sale – in case of an exit for the lower bound.
And as the conclusion …
Breakout strategies have probability of success not above the regular average statistics, but active advertising of the fast earnings with their help makes a deceptive impression. Beginners at first should pick up an effective set of filters of «false» breakouts for the trade system, and also learn to see the operating trend on several timeframe and it is determine correctly the key levels.
The Forex breakout strategies depend on non-standard market factors, technical sliding and speed of execution of orders. All systems of breakout-kickback give trading signals with delay, and therefore the transaction can open on residual movement of the price.
Forex on breakdown the trade techniques using behavior of the price in the field of strong price levels are considered as the best as strategy. As a rule, signals after the fact of breakdown are late, but by means of some receptions it is possible «to catch» steadily the strong movements which can give not only short-term profit, but also allow to open a position at the very beginning of a trend.
Of course, for a steady profit Forex breakout strategies need volatility, but in case of the correct use of these strategies it is enough to use the popular assets of middle volatility is usually enough (the main currency pairs, crosses, raw futures). The real effect is gained in case of trade longer than for an hour, but scalpers can also use signals on breakout as estimation of the probability of a turn. Source:
Social button for Joomla