

")
Long-term trading statistics shows that the Ichimoku trading strategies almost never give negative results. External complexity of chart constructions discourages newcomers, but it provides a stable profit on any instrument to the stubborn ones who spend time on mastering it.
The optimal combination of indicators is the backbone of any profitable trading system, and it can take years to find such. At the same time, the basic package of any trading platform includes a free tool that is a ready-trading system, which if necessary can be easily adapted to any market.
Ichimoku strategy uses just one absolutely unique indicator of the same name, created in the country of the first market theory, Japan, to trade Nikkei index. It has the most balanced mechanism of the analysis of price movement, which is why this indicator is called an indicator of market equilibrium.
Mathematics and indicator settings
The only indicator of Ichimoku Kinko Hyo system builds five main lines on the price chart. Do not be fooled by the ornate Japanese names ¬– the calculations of the lines are fairly simple.
Tenkan-sen, or Tenkan, is a “reversal” line, basic color is red. Short trend line; a simple average (half of the High + Low sum) for the first averaging interval; default value is 9. The trend pointer; the larger the angle of inclination, the stronger direction. As a simple moving average, it serves as a support/resistance.
Kijun-sen, or Kijun, is “standard” line, basic color is blue. An average for the second interval; default value is 26. A more reliable indicator of the trend. If the price is above the line – further growth is expected, lower ¬– the fall is expected. Rebound from the line is a quite strong entry signal.
SenkouSpanA, or Senkou A, is the upper (first) “future” line, basic color is different shades of red. Its value is in the middle of Tenkan/Kijun range, but shifted forward by the size of the 2nd time interval.
SenkouSpanB, or Senkou B, is the lower (second) “advancing” line, basic color is different shades of green. An average for the largest interval, shifted forward by the size of the 2nd time interval. Default value is 52.
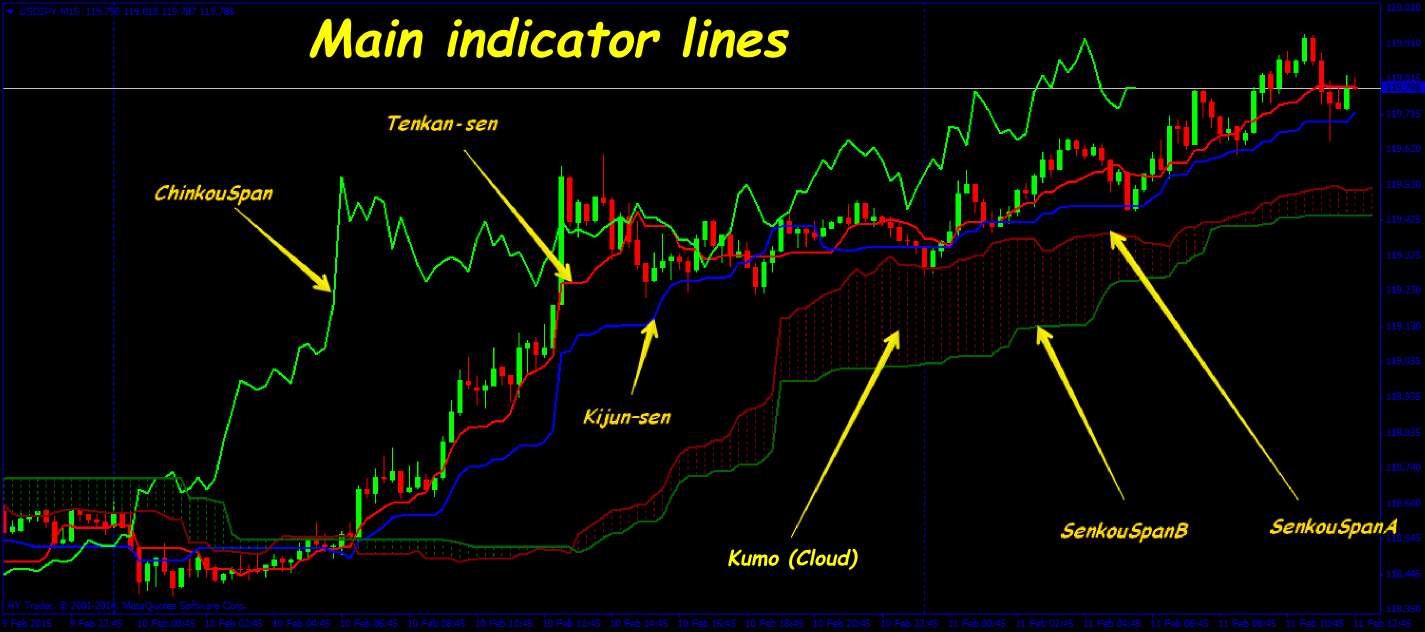
The space between the SenkouA and SenkouB is shaded in different colors, depending on the relative position of lines, forming a graphical “Cloud” (Kumo). As long as the price is inside the Cloud, the market is considered flat, and the boundaries act as strong resistance lines. If the price is above the cloud, the market is bullish, below – bearish.
ChinkouSpan line is a “lagging” line showing the closing price of the candle that is separated from the current by the size of the second time interval.
Application of Ichimoku strategy in real trading
The parameters for the system are based on the settings for the stock market with the market cycle equal to 1 year. Hence, 52 is the number of weeks, and 26 is half of the period. Apparently, the parameter 9 was chosen experimentally, so it is most often varies with individual settings. It turns out that the basic parameters are set to work on the weekly candles, but the system also provides excellent signals within the day, with a small correction in the direction of reducing the equivalent parameters, and strays only in moments of speculative market – for example, after the news.
Important: the last argument for Ichimoku strategy is always the ChinkouSpan line: if at any BUY signal this line is higher than the price, it is an additional confirmation of the trading signal. Any signal to SELL will be more reliable if the ChinkouSpan line will be below the price at the time of entry.
The strategy includes several tactics with individual set of trading signals. Interval is H1 and above, the best is D1.
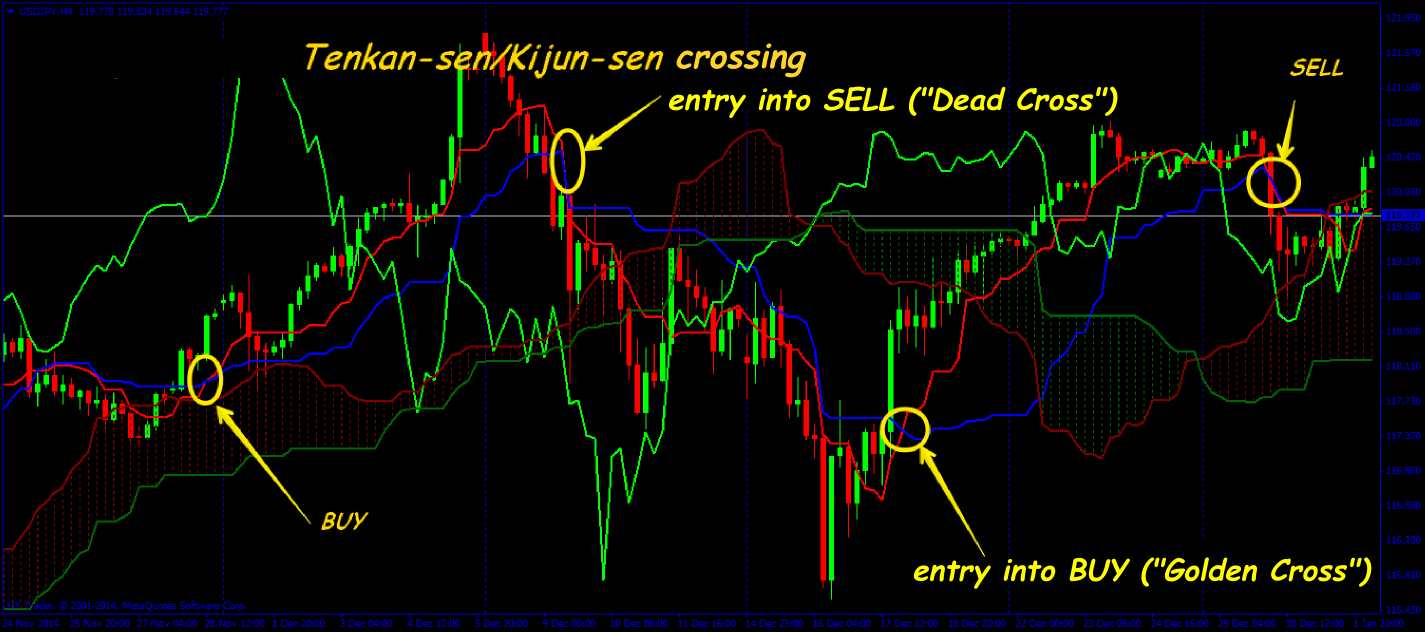
Tactics 1. Intersection of Tenkan-sen/Kijun-sen
Bullish signal: Tenkan crossed Kijun upward, forming a “Golden Cross” pattern. Bearish signal: Tenkan crosses Kijun downward, forming a “Dead Cross” pattern.
Signals occur at the points of intersection of the lines, but they need to be analyzed from the point of view of the overall picture of constructions. To assess the strength of the signal, the following recommendations are used:
Strong Tenkan/Kijun signal: to buy– the intersection must occur above the Cloud boundary, to sell – the point of intersection is below the lower boundary.
Neutral Tenkan/Kijun signal to buy and sell: intersection occurs inside the Cloud.
Weak Tenkan/Kijun signal: to buy – the intersection occurs below the lower Kumo boundary, to sell – above the upper boundary.
Entry: the order is opened in the direction of the point of intersection after the close of the previous candle.
Stop-loss: behind the opposite Kumo boundary, or according to the rules of money management.
Exit: at the reverse intersection of the lines or by take-profit.
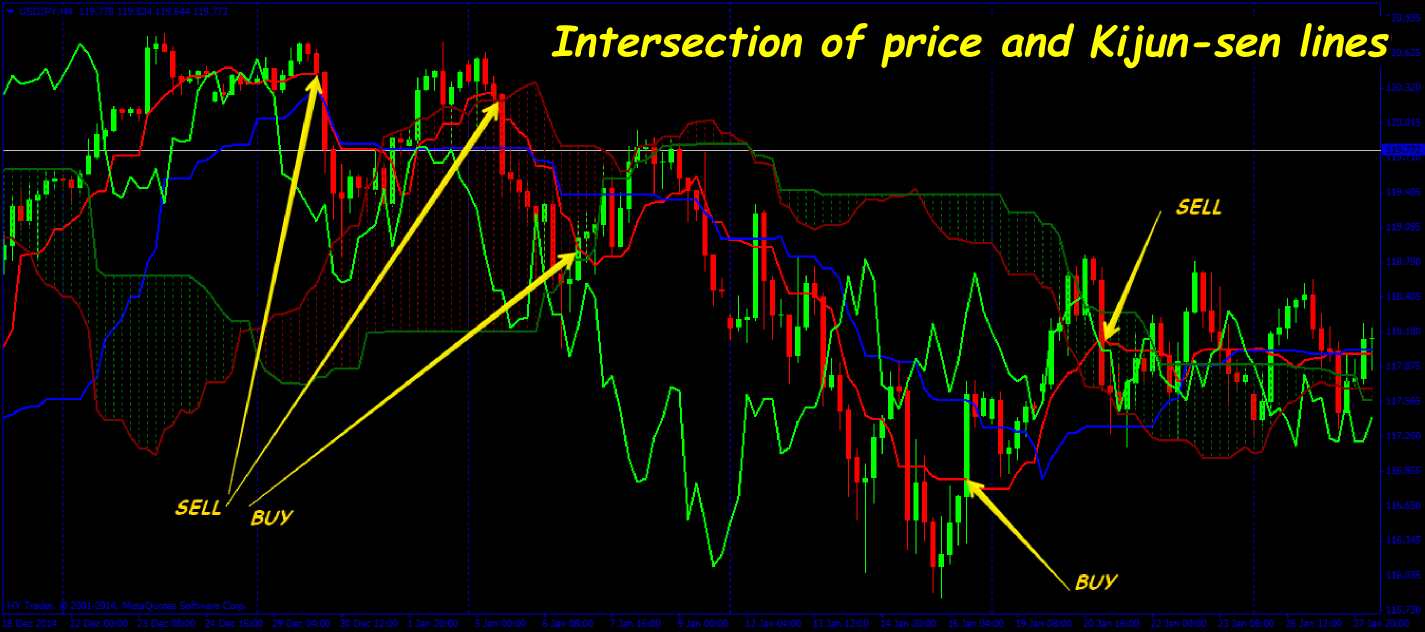
Tactics 2. Intersection of the price and Kijun-sen
One of the most reliable signals of Ichimoku trading strategy. The technique works well on all timeframes, but is less reliable on intraday.
Bullish Kijun signal: price breakthrough upward, closure – behind the line.
Bearish Kijun signal: price breakthrough downward with fixing behind the line.
Strong signals: bullish – the intersection occurs above the Kumo boundary, bearish – below the lower Cloud boundary.
Neutral signals to buy/sell: the intersection between the Cloud boundaries.
Weak signals: bullish intersection – below the lower boundary, bearish – above the upper boundary. Checking out the Chinkou Span line is recommended.
Entry: order is opened after the point of intersection with the trend, but only after fixing of the previous candle. Track the location of strong support/resistance levels.
Stop-loss: 5-10 points from the Kijun line in the opposite direction (above or below the line). You can then move the stop along the Kijun construction line, keeping a 10 points gap.
Exit: at the reverse intersection of Kijun line and price or by the money management rules.
Tactics 3. Trading inside and on the breakthrough of the Kumo area
Cloud area can be quite large, so trading inside it and on the rebound from its boundaries is also possible, but it is the weakest tactics included.
If the overall picture is favorable, use the breakthrough: buy signal is closure of the candle above the upper boundary, sell signal is closure below the lower boundary.
If the buy was opened inside the Cloud, set stop behind its lower boundary, if the sell was opened ¬– behind its upper boundary. Take-profit is the opposite boundary of the Cloud (20% to 120% of the Cloud area).
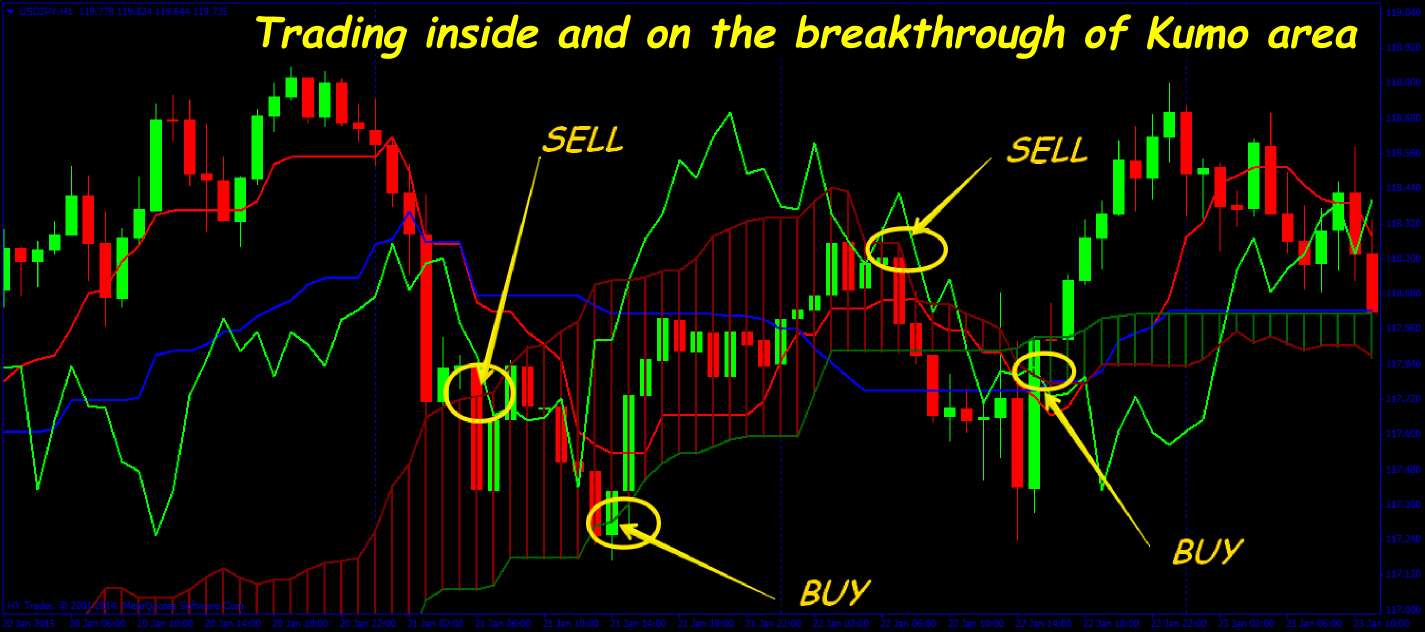
It is also necessary to take into account the “Kumo mood”: if the cloud, for example, is painted in "bearish" color, it is an additional confirmation of the down signal. If the color of the Cloud contradicts your intentions, it is better to wait.
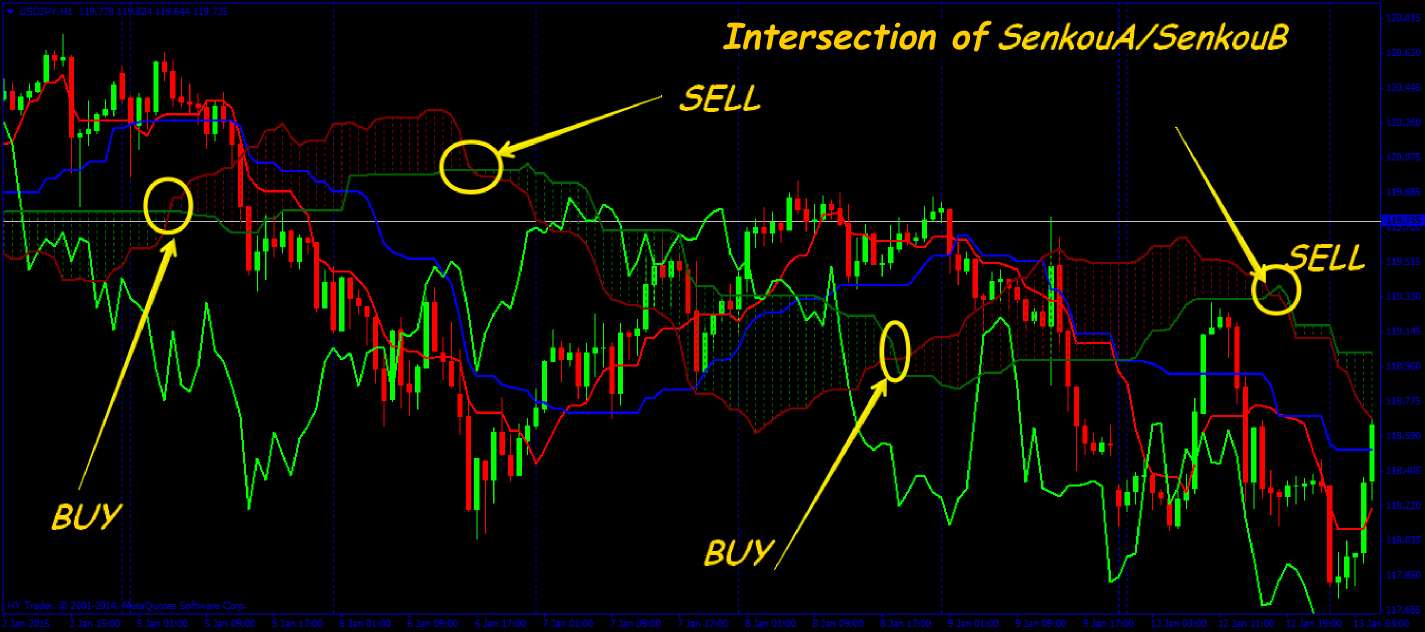
Tactics 4. Intersection of SenkouA/SenkouB
According to the Ichimoku strategy, it is a signal of the likely trend reversal or pullback toward the SenkouA line. If SenkouA is crossed by SenkouB downward and it is confirmed by the change of the Cloud color, it is a buy, in the opposite case – a sell. Reliability of the tactics is mitigated by the fact that the SenkouA and SenkouB lines are built expecting the “future movement”, and the current price is 26 periods away from the lines intersection.
And as a conclusion...
All options of the Ichimoku strategy were so effective that they are actively used in almost any conditions on all the instruments. They combine the advantages of trend pointer and moving averages, and its lines unsurprisingly almost coincide with the wave 50% pullbacks under the basic Elliott theory.
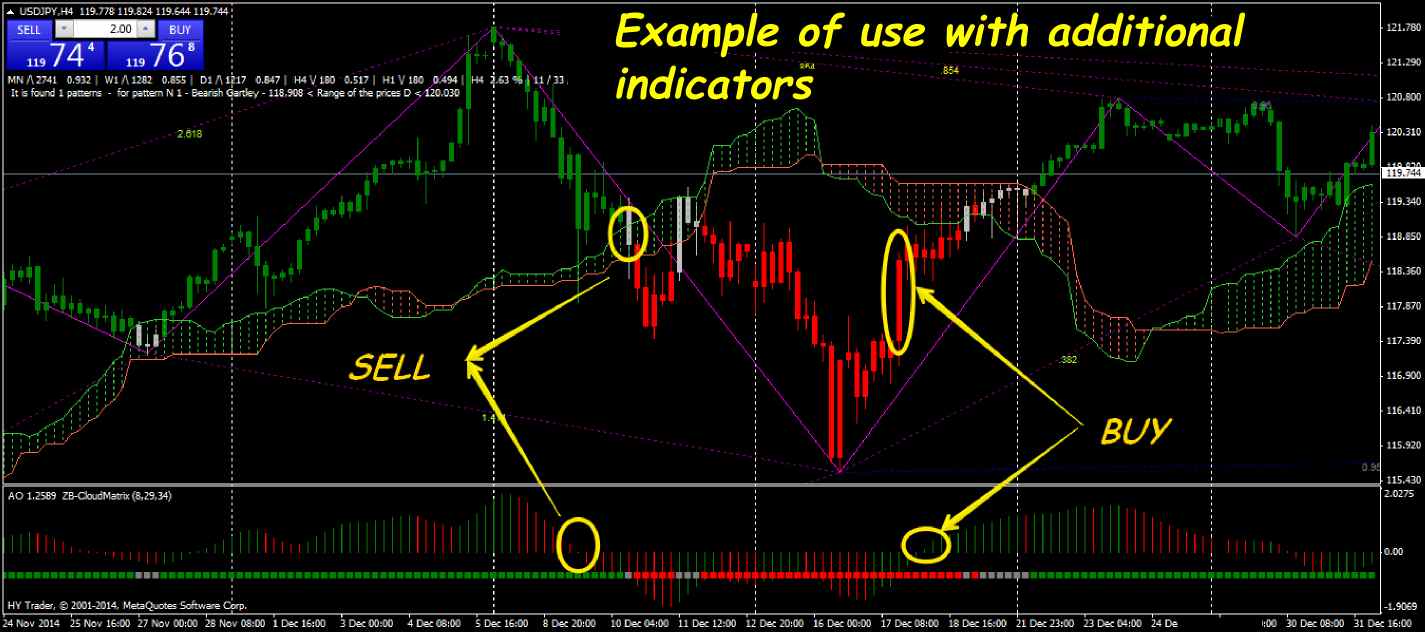
Due to the fact that the mechanism was designed to work with stock indices, there are no other indicators in the standard Ichimoku strategy, but fans of the oscillators are recommended to add volume indicators (e.g. Awesome).
The study of this strategy requires a lot of time, but the result is worth it: at the careful optimization, the efficiency of the generated signals reaches 80%. In addition, understanding of the logic of the Ichimoku is stylish, modern and professionally for any trader. Source: Dewinforex
Social button for Joomla