

")
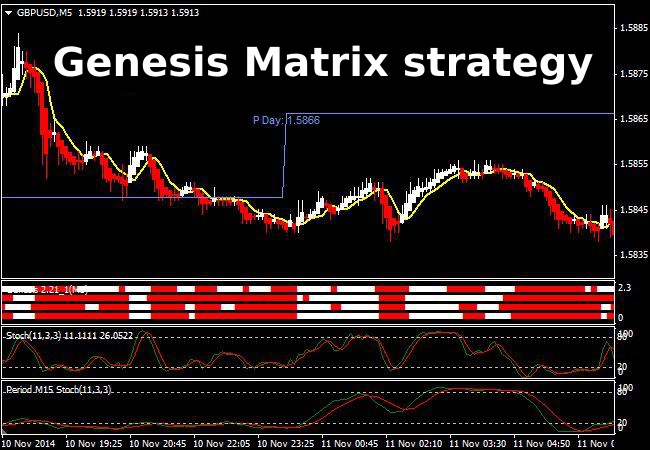
Genesis Matrix strategy became widely known relatively recently, with some traders having already optimized it to trade binary options, as its quality of the signal system was higher than that of similar algorithms.
The matter is that this model was not created from scratch, but rather on the basis of a strategy called Symphonie Trader, the logic of which had the right to live, but the redrawing indicators have completely destroyed the idea. So, the modifications were created to correct this deficiency, one of which is the subject of today's discussion.
The style of the Genesis Matrix strategy refers it to intraday, i.e. it was developed for trading in m5, but numerous experiments have shown that the signals are well processed on higher timeframes when working on middle-term.
The authors didn’t impose severe restrictions on trading tools either, but since the optimal time for transactions is recognized to be the London session, it is best to work on pairs EUR/USD, GBP/USD, EUR/GBP, AUD/USD and EUR/JPY, the range of fluctuation of which is markedly increased after the opening of London.
What indicators are needed to make Genesis Matrix strategy work correctly
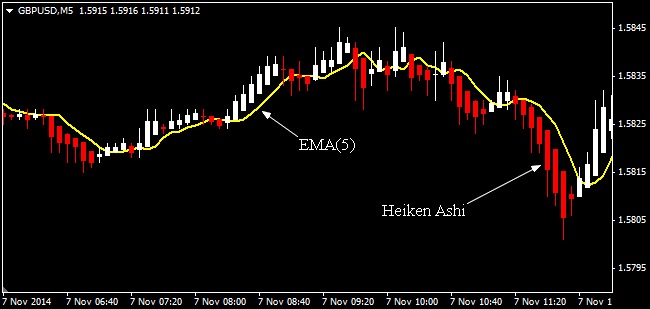
In total, six indicators will be needed – three in the main window, and three more in some "basement" windows, but first things first. The first two algorithms are already familiar to many – they are an exponential moving average built on five candles at a typical price (hereinafter EMA(5)) and Heiken Ashi (hereinafter HA).
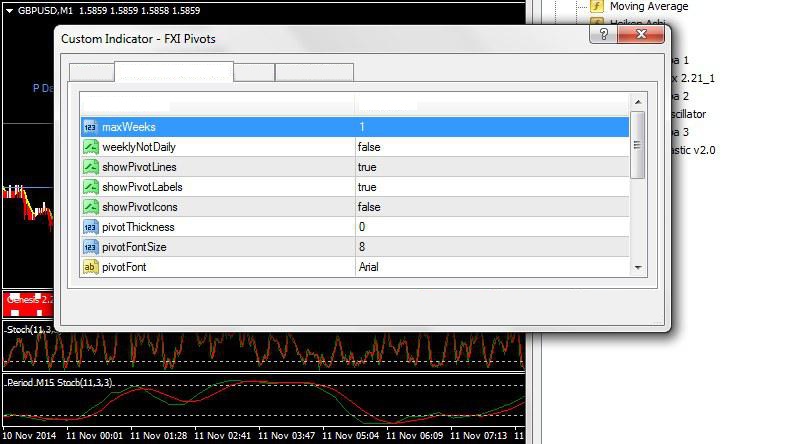
Horizontal levels – the result of marking from FXI Pivots, which calculates the daily pivot levels. Respectively, P is the median line, R 1,2,3 are resistance levels, and S 1,2,3 are support levels. To avoid the overabundance of information, it is recommended to set the following settings:
Just like Symphonie Trader, the Genesis Matrix strategy uses the indicator from “bricks” to identify a trend, under the same name GenesisMatrix, which is based on CCI and is intended for screening potentially losing trades. We recommend that you leave the default settings.
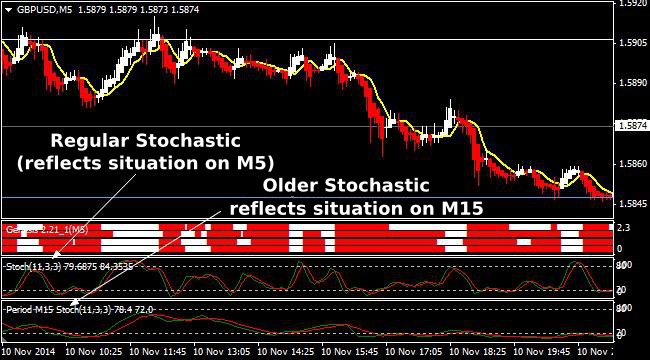
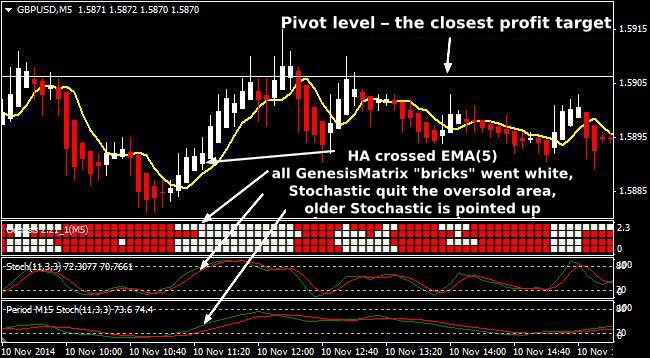
And the last windows display the values of the Stochastic oscillator – the top is designed to assess the current situation, and the bottom shows the state of the market on the larger timeframe – for example, if trading is supposed to be on M5, set the Period Stoch as 15 in the «TimeFrame» setting. The figure below shows an example with explanations:
Genesis Matrix strategy in action: studying signals
In terms of the signal identification, the system is not much different from the majority of similar techniques, the only thing worth noting is that the algorithm lacks “trend module”, as the readings of all the indicators are focused on searching and filtering of pulses. Below is the list of necessary conditions, after completing which it is permissible to open orders to buy:
- HA candle crossed the EMA(5) upwards, and we stress that only the closing of the candle body behind the moving average is considered, and if the last was crossed by the HA shadow, this situation should be treated as a false breakdown;
- All four histograms of the GenesisMatrix indicator (to put it simply, squares or "bricks") changed the color to white;
- Lines of the main Stochastic crossed and quit the oversold area. The default level is 20, which is not recommended to change, because the increase in the lower limit leads to a delay of the signals, and the decrease, in contrast, increases the chance of false entries;
- One last caveat – the Stochastic lines from the older timeframe should be directed upwards. An example of a quality signal is presented in the figure below (by the way, you can see a few "bad" transactions on the same screenshot, which have been filtered by the components of the system):
As you might guess, the Genesis Matrix strategy provides diametrically opposite rules for deals to sell, namely, HA crosses the EMA (5) downwards, all GenesisMatrix histograms turned red, the "main" Stochastic came out of the overbought area (which is higher than 80) and the lines of older Stochastic rushed down.
Accompanying of the positions
The rules of the system don’t provide fixed take-profit as is, but the authors recommend taking profits on two occasions: the first is when the price reaches the round and pivot levels, and the second is when the histogram blocks change color to the opposite.
If these methods are synthesized, we get the following course of actions: set a take at the next strong level (as a backup to protect against connection break and if there is no opportunity to monitor the market in person), but continue to monitor the situation if you can and close the deal when the price tries to reverse.
The Genesis Matrix strategy offers to place a stop-loss behind the nearest local extreme, in case of buying – behind the low, and in case of selling – behind the high, respectively. In the meantime, the author makes one caveat – if the stop is visually too large, we ignore the deal.
I would like to draw attention to the incorrectness of such assessments, as only an experienced speculator can determine the situation when volatility deviates from the norm by feel, so the beginners are recommended to compare the potential profit on the transaction (the distance to the nearest round or pivot level) with the value of the stop, which is expected to be placed behind the low. If profits are less than or equal to risk, ignore the transaction.
Further, if the signal was correct, after reaching a certain level of profit, it is better to move the order to the breakeven or enable a trailing stop. The authors determined this value of floating profit as 20 points for euro, so we can respectively accept it as the standard for all other pairs and recalculate using the ratio of the average ATR in the last 20 days. For example, if ATR(20) = 0.0103 for the pound, and 0.0080 for the euro, the value of profit at which you will need to enable a trailing on the pound is 20*103/80 = 26 points.
Advantages and disadvantages that characterize Genesis Matrix strategy
We have already noted that the main disadvantage of the "predecessor" of the system reviewed today (redrawing of the indicator values) was eliminated by developers, so only common flaws can be identified as weaknesses, which are inherent to all strategies of this class – for example, even a small delay of signals, inflated stop-loss, vulnerability during news releases, etc.
But all the disadvantages are offset by one important advantage – judging by history, the Genesis Matrix strategy is able to make a profit – of course, if you strictly comply with all of the rules. Partly, a positive result is not even due to using histograms, but rather due to a successful combination of Stochastics and Heiken Ashi. Source: Dewinforex
Social button for Joomla