

")
 A trader has only two real instruments for market analysis and decision making: fundamental and technical analysis. If fundamental analysis can have several approaches and at the same time one event can be perceived in a different way by different traders, then technical analysis means unemotional trading decision making method based on invariable indisputable facts.
Technical analysis of forex market includes two large blocks of analysis that can be used together as well as separately:
1. Graphical analysis.
2. Analysis based on indicators and algorithms.
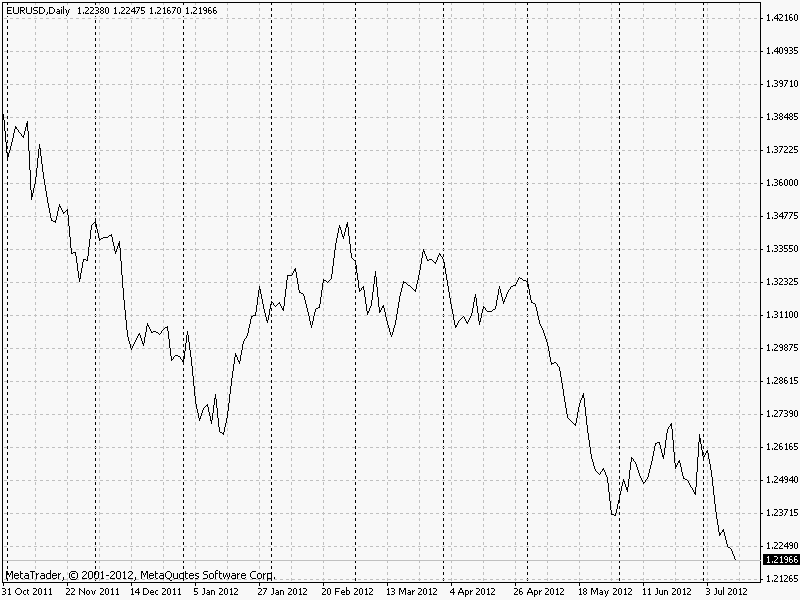
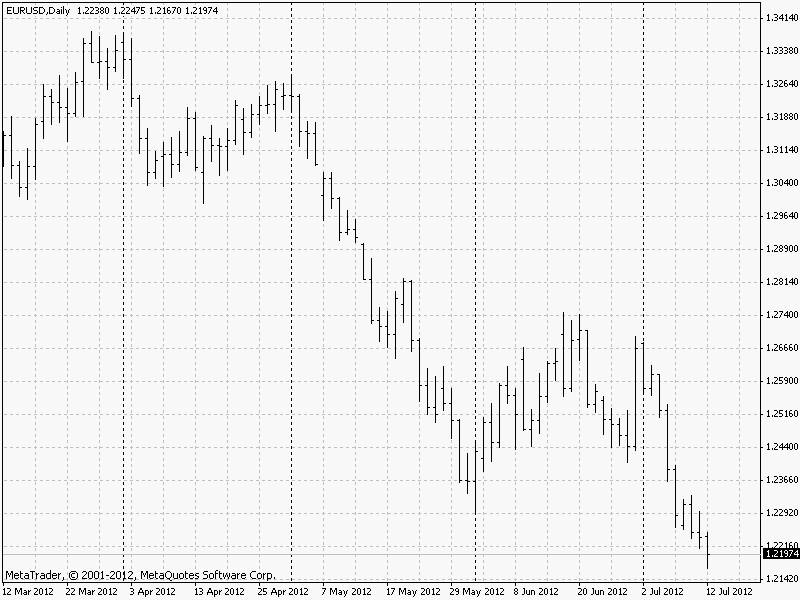
Graphical analysis consists in visual analysis of quotation graph. Quotation graph can be of three types:
1) Linear
2) Bar graph
3) Candlestick chart.
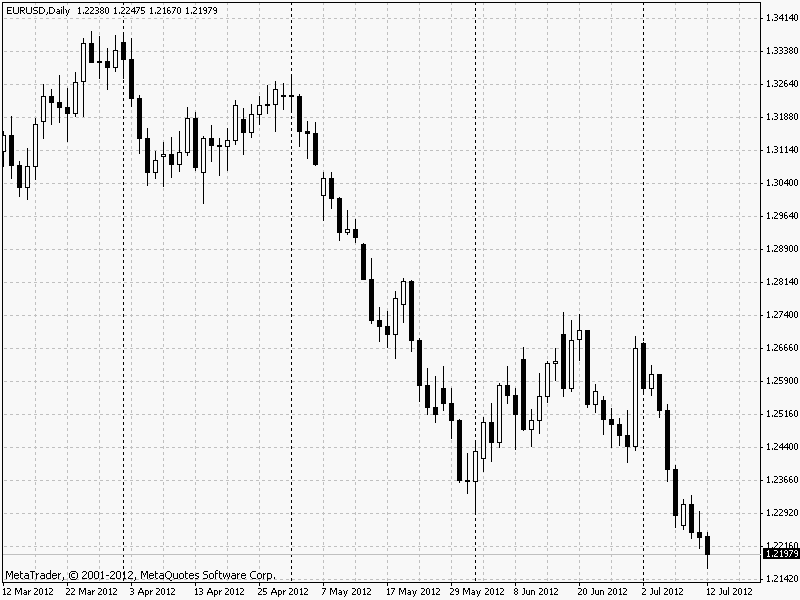
Any of the listed types of graphics can be utilized for conducting graphic analysis. However, the most popular among traders are bar or candlestick charts, since linear one may not reflect maximum and minimum fluctuations because of the principle of evening-out of a graphic point on closing. The usage of bar or candlestick chart is not fundamental. Candlestick chart apart from standard graphic analysis may be analyzed on candlestick models (more about candlestick analysis).
Graphical technical analysis and a prognosis on forex market adds up to finding graphical models, that reflect changes in market participants’ sentiment. The main elements of graphical analysis are:
1) Support level and resistance level building and analysis. Support and resistance levels reflect a market sentiment, that is based on inactivity of thinking and an idea about “dearness” and “cheapness”. If inactivity of perception of price of any assets remains intact, then specific price levels of support/resistance can become overwhelming for quotations. However, since the inertness of the market concerning price level is not eternal, there are level breakdowns on the market occurring all the time, which usually mean the development of a new trend. The levels of resistance/support are built on accumulation of maximal/minimal quotations within previous periods. Price level higher than a current price is called “resistance level” (since the price must overcome it in order to keep growing), and a level lower than level of support (since a given price level maintains the price and does not let it decrease). One should understand that a level of resistance becomes a level of support after bursting up and vice versa. There are two trading tactics of resistance/support levels: trading tactics for price stand-down from level (the level is not broken down, the price went the opposite side) and the trading tactics for a breakdown (the level is broken down and the deal is open with the aim to seize a starting trend).
2) Search for graphical models. There are many graphic models, some of them work for maintaining the trend, some of them point to a trend turnback. The most popular graphic formations are: triangle in different aspects: a flag, a head and shoulders, V-top/cavity, window and others. One may find more information about graphical technical analysis in Jack Schwager’s “New wizards of the market”.
3) Determination of trading bands. Around 70% of the time the market is in flat, when there is no trend and the quotations fluctuate within a defined level. Determination of trading bands allows trading effectively in flat periods within a given band.
If a graphical analysis has a human factor (every trader would draw on the same graphic his own, different from others, levels of support/resistance), then in the second component of a technical forex analysis, human role adds up to algorithm design and its maintenance. Since, as a rule, algorithms have mathematical and statistical methods of quotations history analysis, then given algorithms are easily converted into codes in the form of indicators. On the basis of these indicators a trader makes his trading decisions.
At the moment there are so many various indicators, that characterize the price from different sides. The most widespread and classical indicators are built in the trading terminal and are available for any user. The usage of indicators directly in the terminal allows conducting the analysis as efficiently as possible. Also any trader can develop independently algorithm of indicator and write it for usage.
Indicators are divided in two main groups:
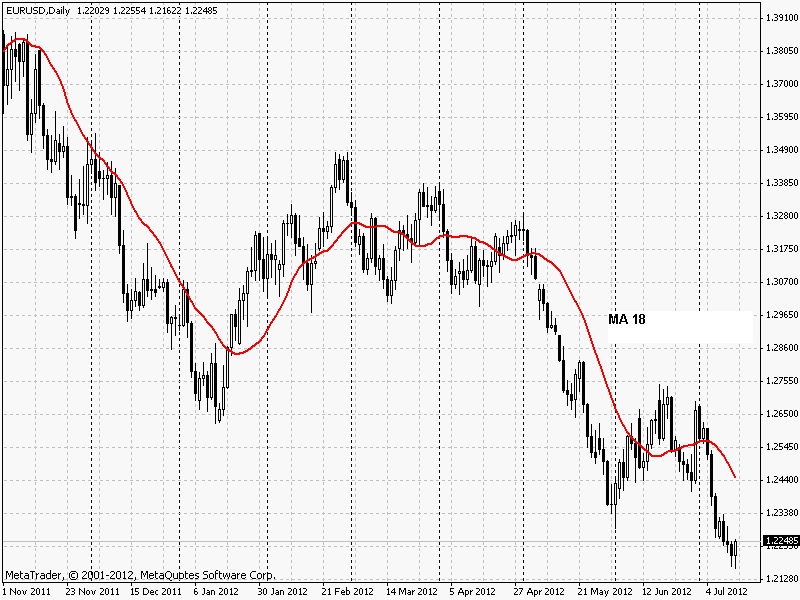
1) Trend indicators, showing the continuation of trend. The example of such indicators is fluctuating average.
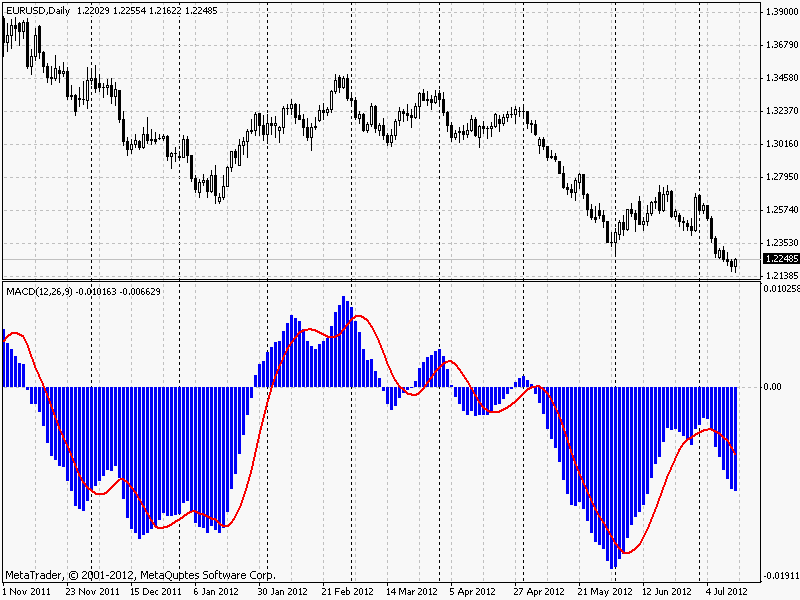
2) Oscillators, determining market rate and making it possible to determine probable crucial points. MACD indicator is a popular oscillator.
You may familiarize yourself with classic usage of the most popular indicators in Jack Schwager’s “New wizards of the market”.
A successful trader must know both methods of technical analysis, even just for understanding possible actions of other traders, since the main set of instruments of technical analysis is identical, thereafter it is quite possible to determine accurately traders’ actions. Source: Dewinforex
Social button for Joomla