

")
Cyclical fluctuations are an integral feature of many physical and social processes, and the foreign exchange market, where thousands of traders and investors commit certain actions every second, is no exception to this rule.
In the recent past, economic cycles were calculated only for the macroeconomic indicators such as GDP, production volume, etc. But since now the computing power of computers allows to work with absolutely any set of data, programmers were able to create more than one cycle indicator for MetaTrader platform.
Which cycle indicators are not worth attention
If you analyze the discussions on the trader forums, it becomes obvious that the community was divided into two camps – the “mathematicians and economists” and so-called “esoterics”. Before writing this review, we did not want to touch on this issue, but it is apparently necessary to remind once again that the first group is the one that goes in the right direction, using specific formula (created specifically for the cyclic analysis) or physical laws (optimized for social processes).
All other attempts to find cycles associated with moon phases, solar activity, etc. is just a hobby of some people who don’t even trade by their own markup, so you shouldn’t take these surveys seriously – this may cost one dear. Accordingly, any cycle indicator will be nothing more than a formula or expert opinion.
Why do moon cycles sometimes coincide with real cycles? It's simple: firstly, there’s an average of 30 days in the moon cycle, i.e., roughly speaking, – a month, and secondly, the main driver of the market is the statistics published by the ministries and governments on schedule – usually once a month. It turns out that the price fluctuations and expectations of the facts sometimes coincide with the moon phases (+/- error), so don’t look for any other links here.
Adaptive cycle indicator for MetaTrader 5 based on the books by John Ehlers
Let's start with mathematics. Ehlers’ theory would seem too complicated for the unprepared reader, so let’s take a quick look at some free indicators created and available for download on mql5 portal, as well as the basic assumptions that guided the authors of these algorithms.
Ehlers’ theory and transforms outlined in his books “Rocket Science for Traders” and “Cybernetic Analysis for Stocks and Futures” are aimed at adapting indicators to current market conditions. In his calculations, John relied on complex numbers and phase vectors, and he used Hilbert transform for the phase vector resolution.
If you are interested in this topic, it is strongly recommended to study the books mentioned above, but if you want to see the immediate result, the figure below represents markup of the Cycle Period indicator, which consists of two lines, the first of which (green) shows the period of the cycle, and the smoothed one (red) acts as a signal.
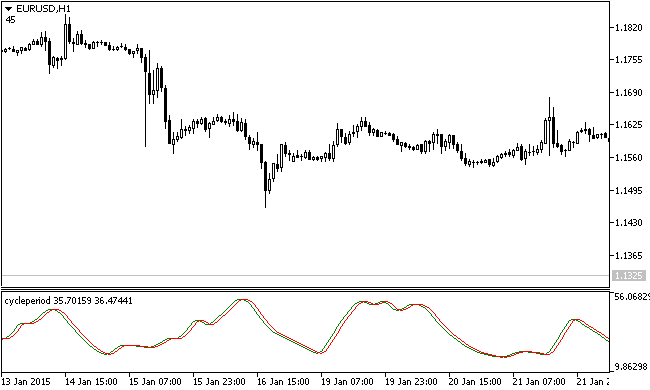
Cycle Period indicator is not an independent algorithm and was created specifically for the further development of the adaptive Cyber Cycle indicator, which, in turn, has generated specific signals to buy and sell at the intersection of lines, in particular:
- If the green line crossed the red upward – buy;
- If the green line crossed the red downward – sell.
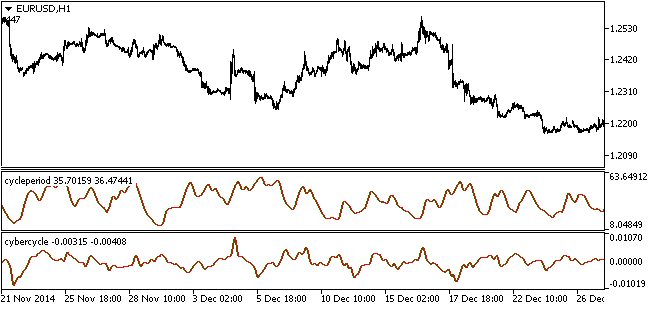
Cyber Cycle is implemented as an oscillator, but its values are not reduced to a fixed value, so the result of the calculation is not distorted, as is the case with the "sticking" of many similar indicators to the upper and lower boundaries. Thus, the Cycle Period function calculates the period, and Cyber Cycle processes the results and binds specific signals to the start and end points of cyclical fluctuations.
Center of Gravity cycle indicator
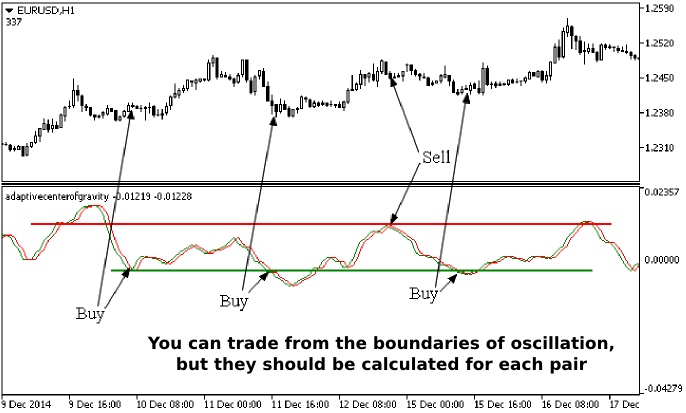
While the previous formula relied strictly on mathematical calculations, the following indicator for MetaTrader 5 relies on the physical concept of the "center of gravity" (hereinafter CG), which is defined as the equilibrium point of the physical body. With regard to the financial markets, the term was somewhat reformulated, i.e. on Forex it is essentially the ratio of products of price and a position of price in space (along the x axis) to the sum of the prices.
Today, there are two versions of the algorithm; the following figure shows the standard cycle indicator Center of Gravity (as well as the formula for calculating CG that explains difficult definition). As you can see, this is an oscillator that generates signals with virtually no delay.
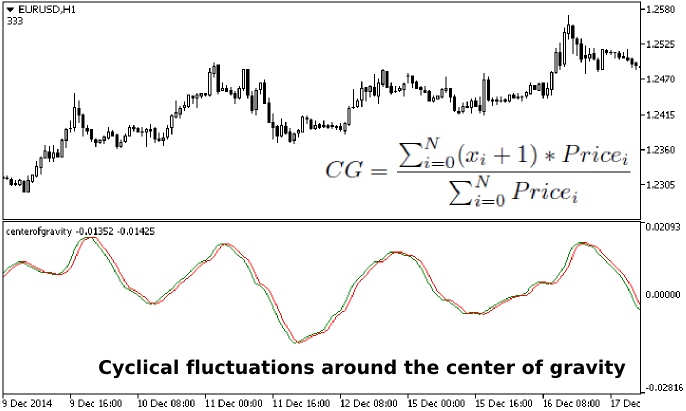
Only two parameters should be set in its settings: “alpha” and “CG window size” (this is N from the above formula, i.e. the number of products). But therein lies the main problem – the fixed value of the range does not allow an objective assessment of the situation on the market by definition, so the adaptive CG cycle indicator was created later, in which the size of the window has been replaced for the period of the dominant cycle, integral to the Cycle Period.
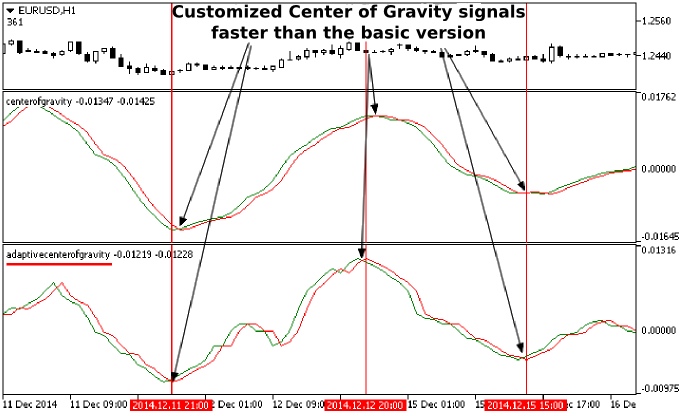
As a result, traders became enabled to save time on the calculation of the optimal CG value, delay of signals has reduced (at least by one bar), and some false signals generally ceased to appear. For comparison, let’s compare two algorithms:
It should be noted that there is another indicator with exactly the same name in the web, but firstly, it is designed for MetaTrader4, and secondly, the algorithm of calculations in its basis is fundamentally different from the cycle nature and is based on trading inside the channel.
The most popular cycle indicator in the economy
In conclusion of the topic, let us recall that the search for cycles is not limited to a technical analysis – as already mentioned, global economic cycles were calculated earlier and still have much more weight than formula.
One such indicator is the Purchasing Managers' Index, reflecting the view of purchasing managers in manufacturing surveyed by Bloomberg. This index is considered as advancing, as the mood in the business environment changes before the corporations publish negative reports and financial markets begin to fall.
Cycle indicator in economic terms is treated much easier than technical tools, as no additional calculations are any longer required here: it is sufficient to follow the following set of rules:
- If PMI index is above 50 and growing ¬– the economy is on the rise, you should expect an increase in demand for the national currency;
- If the index is above 50 and falls – the economy is slowing, so sale of currency is more likely;
- The index is below 50 and falls – recession can begin in the near future, or a crisis is already in full swing, the national currency can devalue or face a program of quantitative easing;
- The index is below 50 and growing – the number of optimists in the business environment grows, but the general mood remains negative, probably the currency market will see correction (wave of buys).