

")
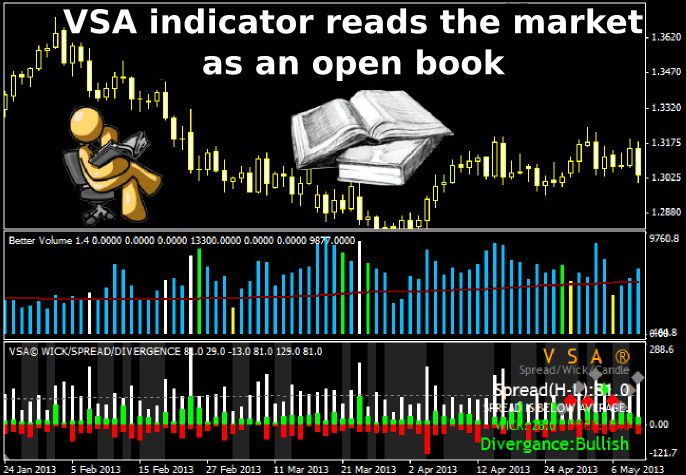
Method of Volume Spread Analysis, which reveals manipulations and "smart money" transactions, is rapidly gaining popularity, but while 5-6 years ago the traders studied the market on their own, now the VSA indicator can take some of the functions.
To immediately send a thought in the right direction, let’s recall some theory. Unfortunately, many new traders understand VSA as a simple histogram analysis of the volume, which is not quite true. Of course, it is an important part of this method, but the candle’s spread plays no less important role here.
In this case, spread refers not to the difference between the ask and bid prices, but to the range of candle from High to Low. When reading analytics at specialized forums, you can very often find phrases like a "short candle – a false alarm", or "the price is too smeared, it is reasonable not to open a deal". These are not subjective opinions, but the conclusions based on VSA.
VSA indicator, which measures the spread of candles
Currently, there are several similar algorithms (even a beginner in programming can create them – all it takes is to subtract the low of the candle from the high), so we won’t recommend the simplest versions now – instead, consider an interesting example called VSA WSD HISTOGRAM.
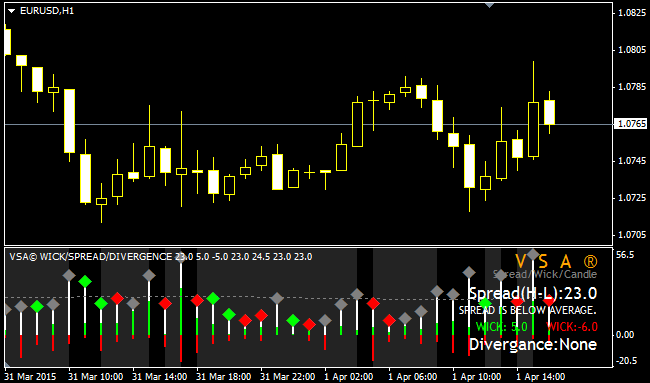
Motley markup is a bit shocking, since the main purpose of the supporters of Volume Spread Analysis is trading on a clean chart, but we should not jump to conclusions, because this VSA indicator does not use any additional formulas, and all this "painting" is only used for the best perception of the patterns.
Each bar in the histogram is the spread, it is shown to the right in the information display (white numbers). The gray diamonds above the bars indicate the neutral situation, but green and red, in contrast, show the so-called divergence:
- if a green diamond appeared – it’s a bullish signal;
- if a red diamond appeared – bears are stronger.
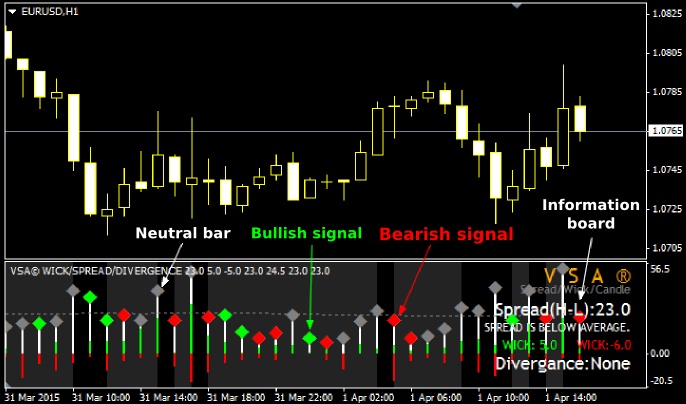
In addition, the VSA WSD HISTOGRAM indicator measures the length of the candle shadows; these values are represented by green and red bars on the histogram, and the information board of the expert shows only the values for the current bar (in front of the wick variable).
This function can’t be disabled, but if it overloads the chart, you can always reduce the thickness of the lines in the settings. But we do not recommend to ignore such valuable information, as in many candlestick patterns the proportions between the candle body and its shadows are taken into account, and it takes much time to measure them manually.
As for the other settings, there is nothing to tell: by means of a ShowText variable, you can enable/disable display of the main text, and the MA_Length parameter is responsible for the period of the moving average that measures the average value of the spread (by default, its period is equal to 100). The other parameters are used to set colors.
VSA indicator for volume analysis
As already mentioned, spread analysis is an important component of the method discussed today, but it loses all meaning without studying the dynamics of volume. It makes intuitive sense, because the range of the candle on the chart is visible to the naked eye, but the most valuable information about the motives of large speculators and market crowd can only be obtained from the volume.
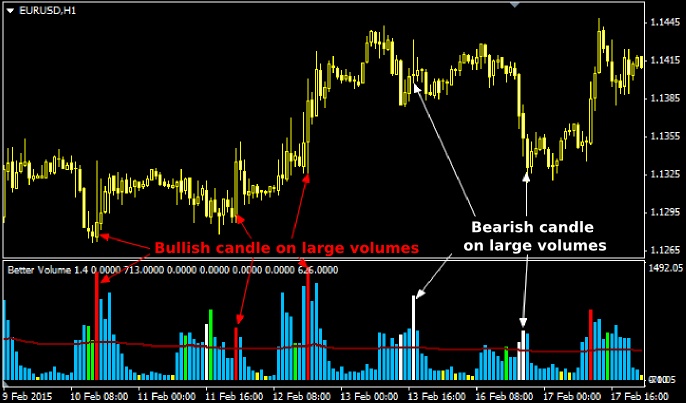
Better Volume indicator was specifically created for this purpose, which assigned certain colors to standard Volumes bars depending on the appeared pattern. Currently, this VSA indicator works correctly in all versions of the MetaTrader terminal (mq4 and mq5 versions are created), and the most recent modification is shown in the chart as follows:
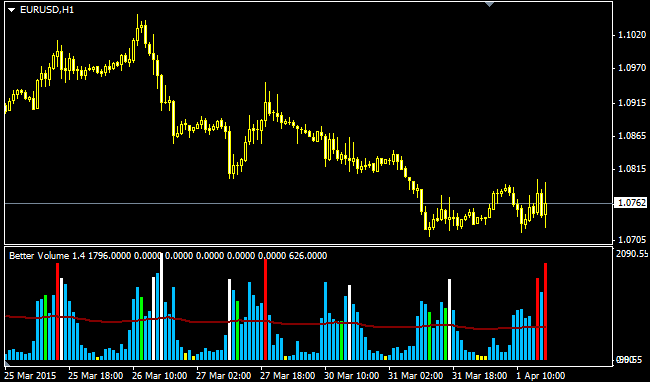
The white color is assigned to the bar when a bearish candle appears on large volumes. Such a situation can often be seen on the decline of the bearish trend, i.e. when sells are joined by the nonpros under the influence of emotions, or at the time of mass activation of stop orders from buyers. Also a white bar may indicate a birth of a new downtrend.
The red bar in its meaning is the opposite of the previous one, as it is formed on the bullish candles with large volume. According to our observations, the listed patterns are formed on the currency pairs with the same frequency both in the beginning, and at the completion of the trend.
If the VSA indicator painted a green bar, it means that the market saw a large volume during the flat, in other words – the appropriate candle had low spread. This is one of the most complex patterns in every sense of the word, since, firstly, false signals are not uncommon on the history, and secondly, a similar phenomenon may be due not to the activities of major market operators, but due to the usual "news chaos".
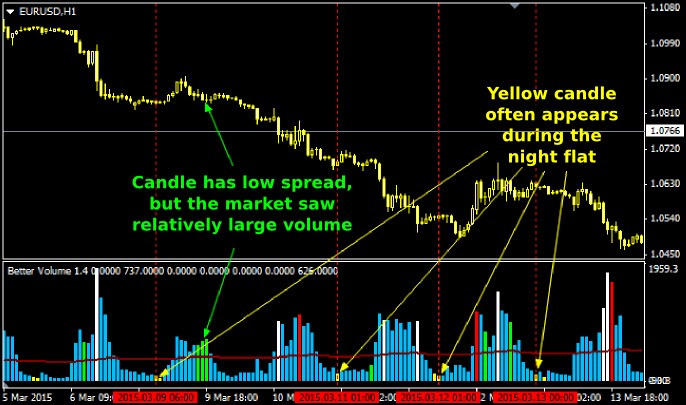
Bars of yellow color are characteristic of the candles with a small volume and low spread, they usually appear during the "night flat" (a period of low trading activity), but if a similar pattern emerged during the operation of the major sites, it could signal the end of the trend (even the crowd lost interest in the movement).
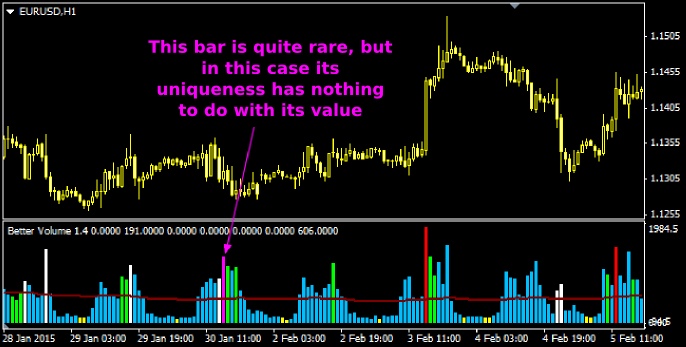
The final pattern that the VSA indicator identifies is presented as a purple bar on the volume histogram. The author argues that this signal appears on a series of candles with a large volume, but experience has shown that this phenomenon is so rare that it can be ignored.
Summary of findings and recommendations
Before writing this article, we had plans to also review a signal VSA indicator (with arrows on the patterns), but in the process of testing several algorithms it became apparent that they are useless, and instead of helping the novice they would ultimately confuse.
This is due to the fact that the provisions of the "analysis of volumes and spreads" are not a guide to action and are not backed up by strict rules; here much depends on the overall situation observed over the last few days (or even weeks). In other words – it is first necessary to understand the context, and only then to look like a single pattern fits into the overall picture.
As an example of such a situation, we can point at a monthly stir in the foreign exchange market before and after the publication of Non-Farm Employment Change statistics. Of course, the patterns formed on such news are often false – moreover, even after a few days the market can give an "echo".
Experienced trader will in this case figure out the situation, but the VSA indicator won’t, because it is a primitive algorithm, not even a neural network trained by taking into account similar outbursts in the past. Therefore, we recommend to soberly assess the possibilities of such tools.
Another important thing that should have been mentioned in the beginning is associated with the type of volume. The matter is that the MetaTrader4 terminal uses tick data, i.e. the bar of the Volumes histogram reflects not the actual amount of volume for all transactions, but simply the number of price changes.
Unfortunately, this fact somewhat distorts the result of the analysis, as the boundaries fade between small transactions and operations for the millions of dollars. This problem can be solved very simply – with importing data on the real volume from the futures market.
Social button for Joomla