

")
Tools of this type are the basic element of the any indicator trade system, therefore the right choice of the oscillator can give to the trader serious advantage. Let's consider the most popular options of the oscillators and try to estimate their practical benefits for the market.
The term Oscillator comes from Latin oscillo (the fluctuating system) and means movement of the price in some range of the extreme values with obligatory return to an average value. Mathematically values of the oscillator are a derivative of the price on time (±) some shift.
The right choice of the oscillator is based that they reflect market speed: it is recognized that reduction in the rate of growth or fall signals about close change of a tendency or, at least, a long flat. The traders, preferring the technical analysis for making decision, use oscillators only for estimation of the force of the operating trend and search of a point of a turn.
A recurrence criterion of the oscillator to some average («normal») value is used in trade in the financial market - then the most reliable moments for an entrance to the market in the direction of the current tendency appear.
General rules of the analysis of oscillators
The next events are the general trading signals of oscillators:
- crossing of the oscillator`s line with the average line (for Momentum and CCI - 0, for RSI - 50, for ROC - 100);
- crossing of the oscillator`s line with the critical zone boundary, and it is recommended to adjust a settlement levels: to lift on a strong bull trend (40/60), to reduce on bear (20/80), and the levels 30/70 in a standard way work on the flat market.
- points of a turn of the lines after an extremum in zones of an overbuy/ oversold;
- mutual crossing of indicator`s lines.
The oscillators give the most reliable signals on the position opening in a flat. On a strong trend the negative analysis result will only confirm force of the current trend, that is – if the price after an oscillator signal nevertheless doesn't move in the expected direction, then the trend proceeds, and we consider a turn signal on the oscillator as false.
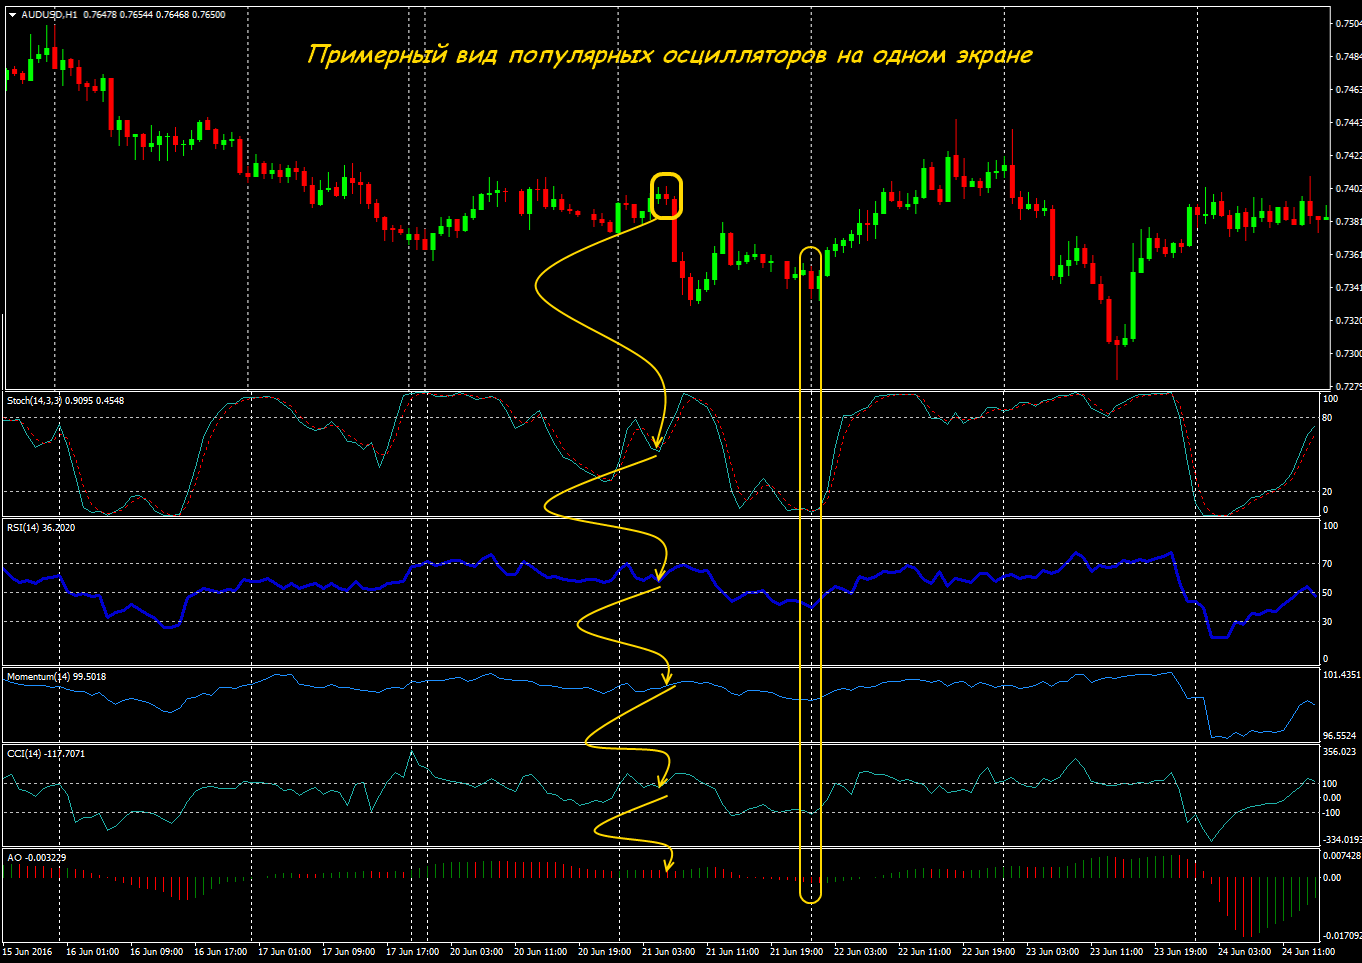
The approximate scheme of carrying out price analysis by means of the oscillator
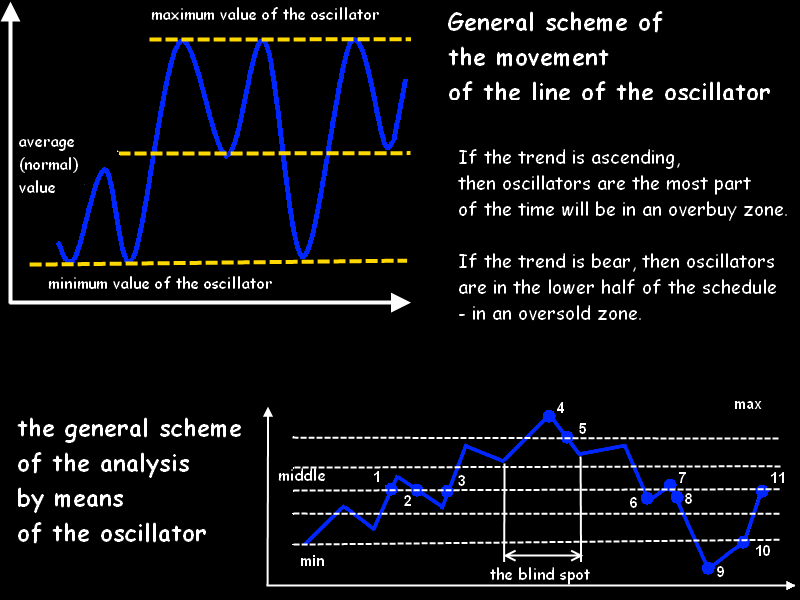
1. The signal appears when the oscillator`s line is crossing the average line (from the bottom upwards). If there were positions on a purchase, you can close partially. For a new position up – the weak signal.
2. Return of the oscillator to a zone below the average line. It is possible to open short-term sale.
3. Repeated crossing from the bottom upwards. We keep sales, including in a «dead» zone, until a maximum.
4. The first signal for opening down. We wait for confirmation (breakthrough of boundary).
5. A good point for an entrance to sales.
6. A weak signal - crossing of the average line. It is possible to close a part of sales.
7. Return of the oscillator to an area of values above of the average line – you can open short-term purchase.
8. A weak signal - we wait.
9. We close all sales, because it`s a strong signal for purchase. You can wait for confirmation.
10. With guarantee we enter to purchase or we are added.
11. The crossing of an average from the bottom upwards again: it`s recommended to close purchases (in whole or in part).
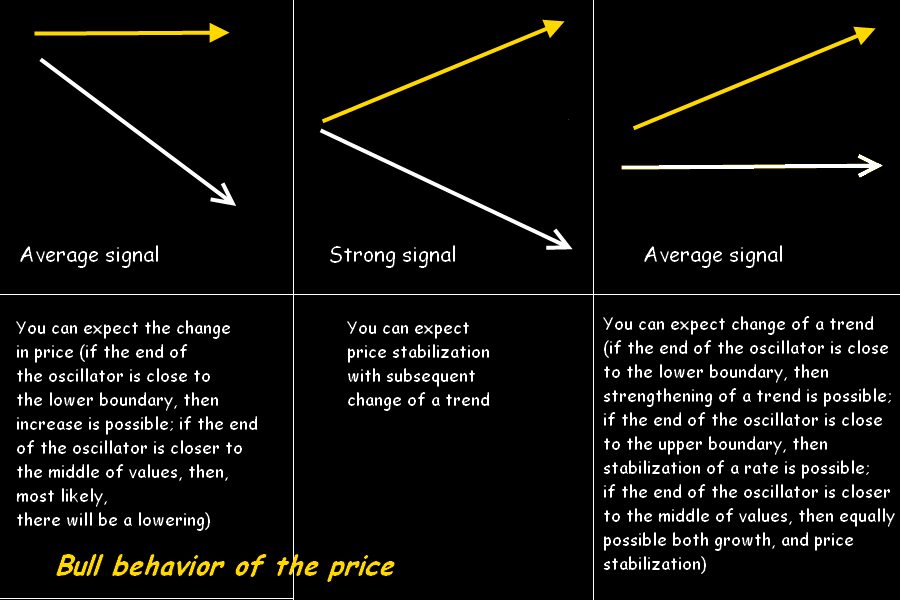
Standard schemes of cooperation of the oscillator with the price chart
In the ascending market:
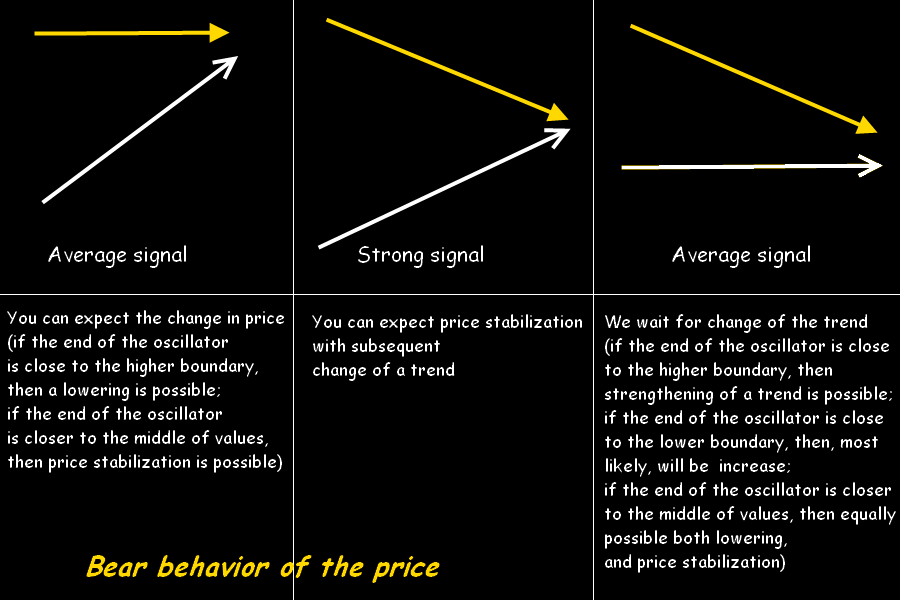
On the falling market:
Synchronous moving:
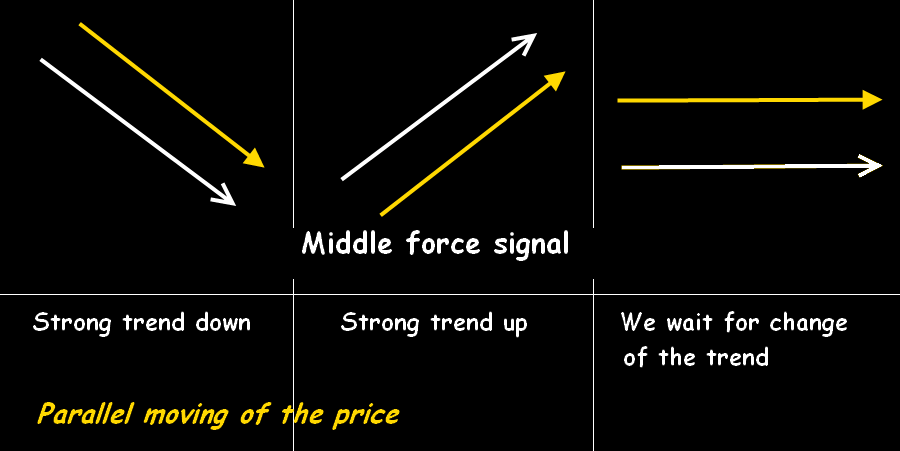
The right choice of the oscillator allows to fulfill effectively transactions in both directions in a wide flat, but on a strong trend - all oscillators, as a rule, deceive. Moreover, if it is obviously visible that oscillator signals false (after a key point on the line of the indicator the price doesn't hurry to reverse in the corresponding direction), then this situation speaks about strengthening of the operating trend. And you can trade in this case only in the direction of the current tendency.
Most often the choice of oscillators is carried out among the indicators entering a standard set of all popular trade systems.
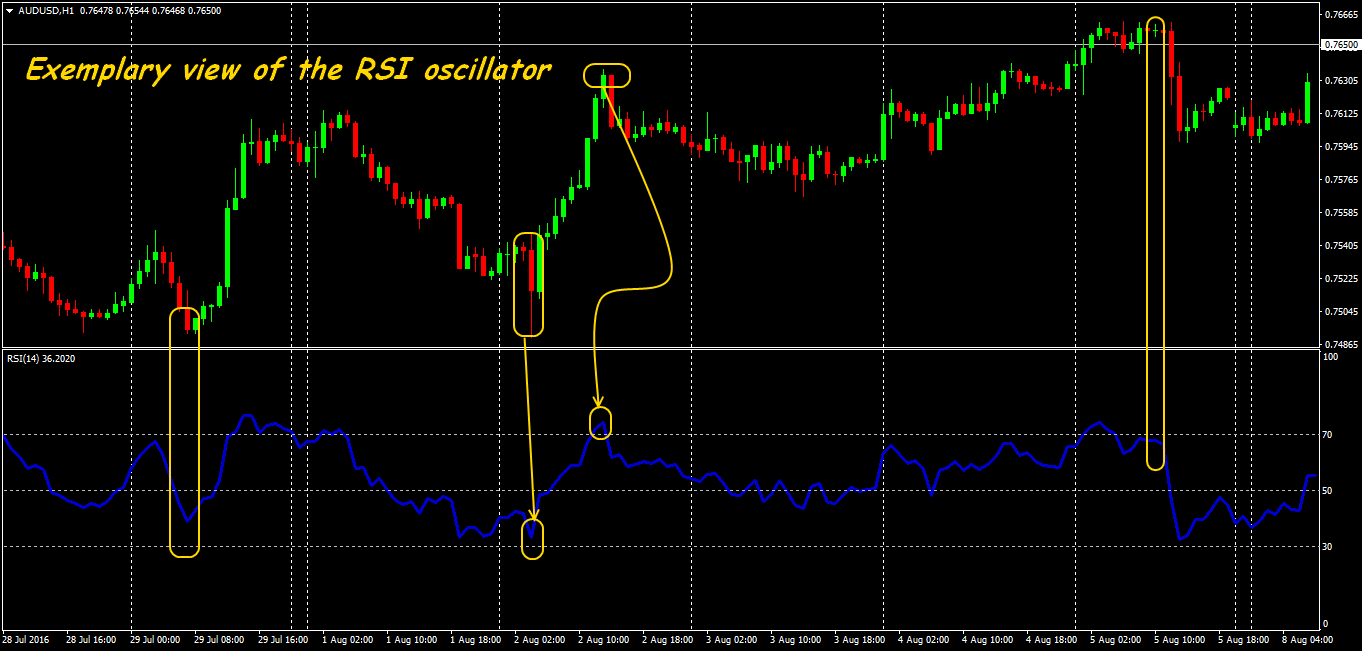
RSI – the most clear oscillator
Relative Strength Index is the most precisely corresponds to the main methods of the technical analysis. It compares value of a surplus of the prices during the periods with closing higher than previous, to price losses on sites with closing lower than a previous period.
Calculation:
RSI = 100 / (1 + D (P, n)/U (P, n)),
where:
U (P, n) - the sliding average of price growth for n of the periods,
D (P, n) - the sliding average of fall of the price for n of the periods.
Indicator values are in the range from (0; 100), in an additional window by means of horizontal markers two control levels are constructed. In case of the choice of the oscillator it is meant that if the line of the indicator rises above the top control level, then the market is oversupplied by purchases and it`s recommended to enter sales. If RSI crosses the lower control level, then the market is oversold and it`s worth waiting for a turn up.
The bigger period is chosen for the analysis, the more there shall be an indicator parameter. The use of a couple of RSI with different settings makes the stable result.
A lack of RSI is the large number of the false signals on position closing and the unreliability of possible divergences, especially on the short periods. Often the choice of the RSI oscillator is caused by the fact that its advancing effect is considered the strongest of all indicators of this type. On lines of the indicator you can build the advancing support/resistance levels similar to the trend, and also on its line own graphical patterns («Double Top-Bottom», «Head-Shoulders»), which are rather precisely fulfilled, are created.
Stochastic oscillator
Technically the Stochastic compares the current price of closing with a price range for some period. The critical zones of the overbuy /oversold are allocated with the horizontal levels. The indicator rather precisely determines availability of a trend or a flat, the main thing is correctly define with parameters. In an additional window the indicator is provided by two lines: the main %K (continuous) and additional %D, which represents the sliding average from the main line.
Calculation of the %K line:
%K = (CLOSE - MIN (LOW (%K))) / (MAX (HIGH (%K)) - MIN (LOW (%K))) * 100
where:
CLOSE - current price of closing;
MIN (LOW (%K)) - the smallest min for number of the periods of %K;
MAX (HIGH (%K)) - the greatest max for number of the periods of %K.
Calculation of the %D line:
%D = SMA (%K, N), where N - moving average period.
As a default simple sliding (SMA) is used, but the use of the other methods of creation of average is allowed (exponential, smoothed, weighted average).
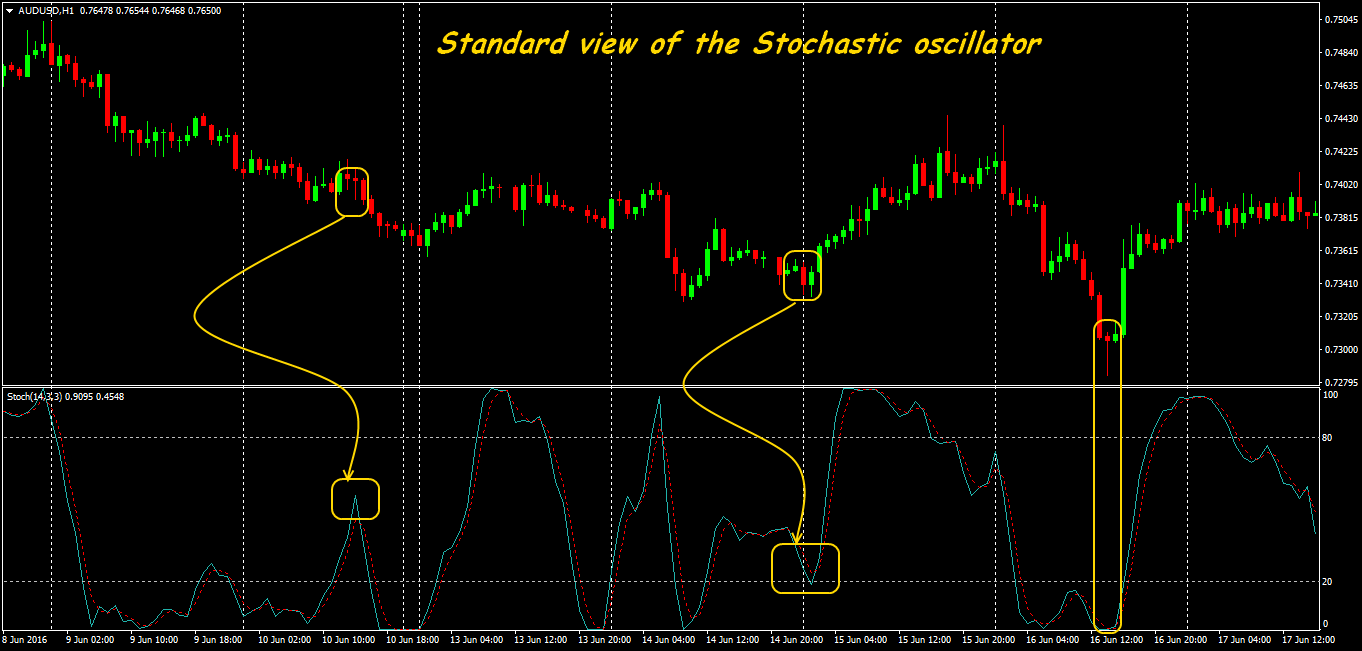
Basic interpretations of the stochastic signals:
- a signal on the purchase arises on a turn of the lines from area 20(30) up, a signal for sale - in case of a turn from area higher than 80 (70) with breakthrough of a bounder;
- relative positions of the lines: if the %K line rises above the %D line – purchase, if moves below %D - sale;
- divergence of the price and main line of the indicator;
- breakthrough of the central line - turn signal, only weaker.
Lack of all options of the Stochastic traditionally is shortcomings and remade drawing because calculation uses only data on history (the price, the amount or the price + amount). Though on the strongest trend in particular stochastics most precisely show the beginning and levels of possible corrections.
The problem of delay of the stochastic is usually solved experimentally with the help of the «period of delay of %K» parameter, which determines the degree of an internal smoothness of the main line: the more parameter, the more slowly will react the indicator, the less often there will be a trading signal, but the result will be more reliable.
RSI and Stochastic are the most clear «signalers» of the turn points.
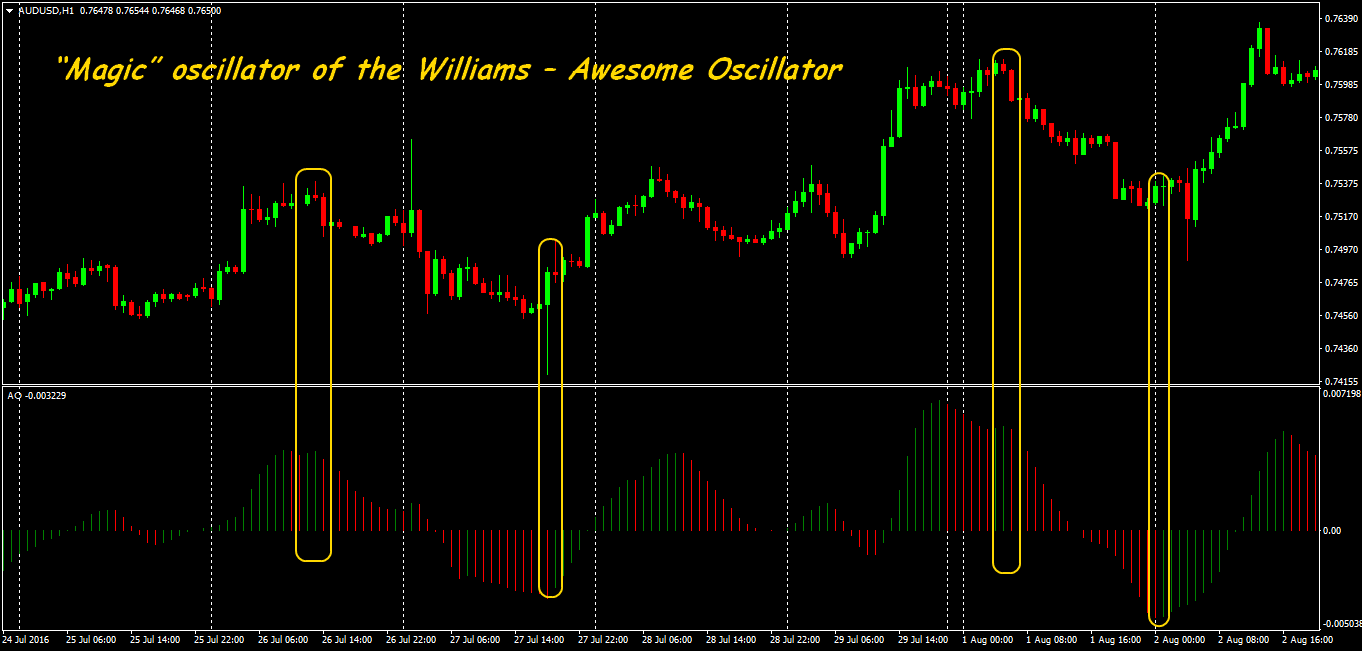
Awesome Oscillator
Though the author included the term «oscillator» in the title, in case of the choice of oscillators often forget that technically this indicator of acceleration of the price represents the color version of MACD (parameters 5 and 34, but without alarm lines), calculated on the average price of the bar, therefore the trading signals are the same. It turns out that from all oscillators it more precisely reflects the current trend. Change of the direction of acceleration is shown by a change of color of the histogram. Calculation:
AO = SMA (Median Price, 34) - SMA (Median Price, 5)
where
Median Price - a price of the average bar, or (high + Low)/2 (high - maximum
and Low - minimum price of the bar);
SMA - a simple moving average.
 Signals:
- On purchase - if the AO histogram is higher (or below) than the zero line and changes color with red on green and the direction from below to up. For sale - a reverse situation.
- A signal on purchase – a crossing of the zero line from below to up, for sale - from above to down.
A use of the AO indicator allows:
- receive a signal of the termination (or easing) the current trend;
- correctly choose the tactics of support of the transaction;
- for fans of the wave analysis - see the termination of a separate wave (or wave structure);
- in time leave and limit possible losses.
A lacks of indicator are standard: delay in the trend market and a set of small false divergences.The AO+Stochastic combinations shown good results in practice.
Speed indicator Momentum (or ROC)
Mathematically Momentum shows the size of the change in price of the financial tool for some period. It shows force of the specific direction of the market, sometimes is also called the indicator of number of movement or an impulse. It is calculated as the relation of today's price to the price of n periods back:
MOMENTUM = CLOSE (i)/CLOSE (i - n) * 100
where
CLOSE (i) — closing price of the current bar;
CLOSE (i - n) — closing price of n bars back.
On a trend the signal to purchase arises, when the Momentum line forms a hollow and turns up; a signal to sale - if the line reaches a peak and turns down. For best accuracy points of a turn of the indicator apply the short sliding average. Extremely high or low indicator values assume a continuation of the current trend. But anyway, in case of the choice of the Momentum oscillator as the basic filter, you shouldn't hurry with opening (or fixing) transaction: a confirmation by the price of such signal is required.
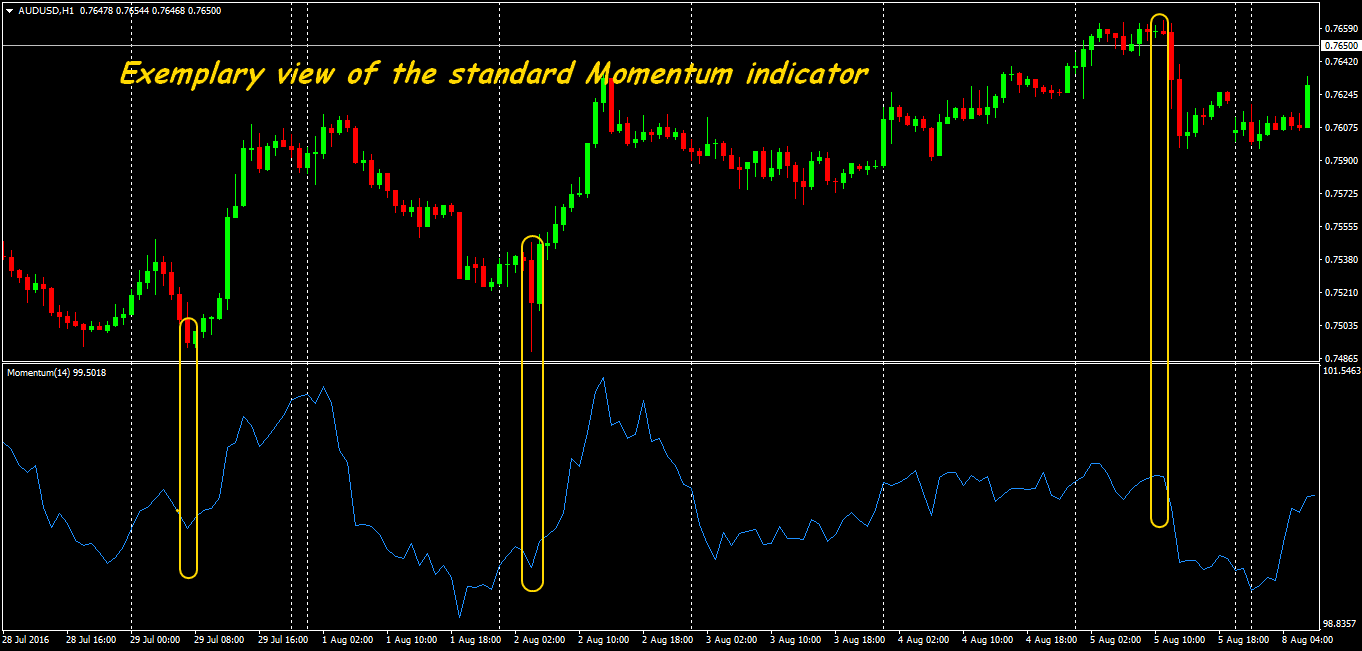
The advancing signal of the Momentum indicator uses the fact that the final phase of a trend is always followed by the sharp change in price. That is it characterized for a bull trend – a rapid growth, because most of the players still believe in its continuation, for the descending – a fall, as all hurry to leave the market. In both cases the emergence of discrepancies between the line of the indicator and the prices is possible.
Period N and a price type is the parameter of the indicator, value of the period from 5 to 10 is most often applied to closing prices. The value N is more, the more long-term and stronger trend is tracked.
A use of the momentum signals:
- identification of the current trend: the positive values - ascending, negative - descending, crossing of zero line - the change of a trend is to occur;
- confirmation of a trend in case of position opening;
- Identification of the overbuy / oversold for closing of the transaction, or for an entrance on countertrend strategy;
- situations of divergence warn about a close turn, but make a sense only on the long periods.
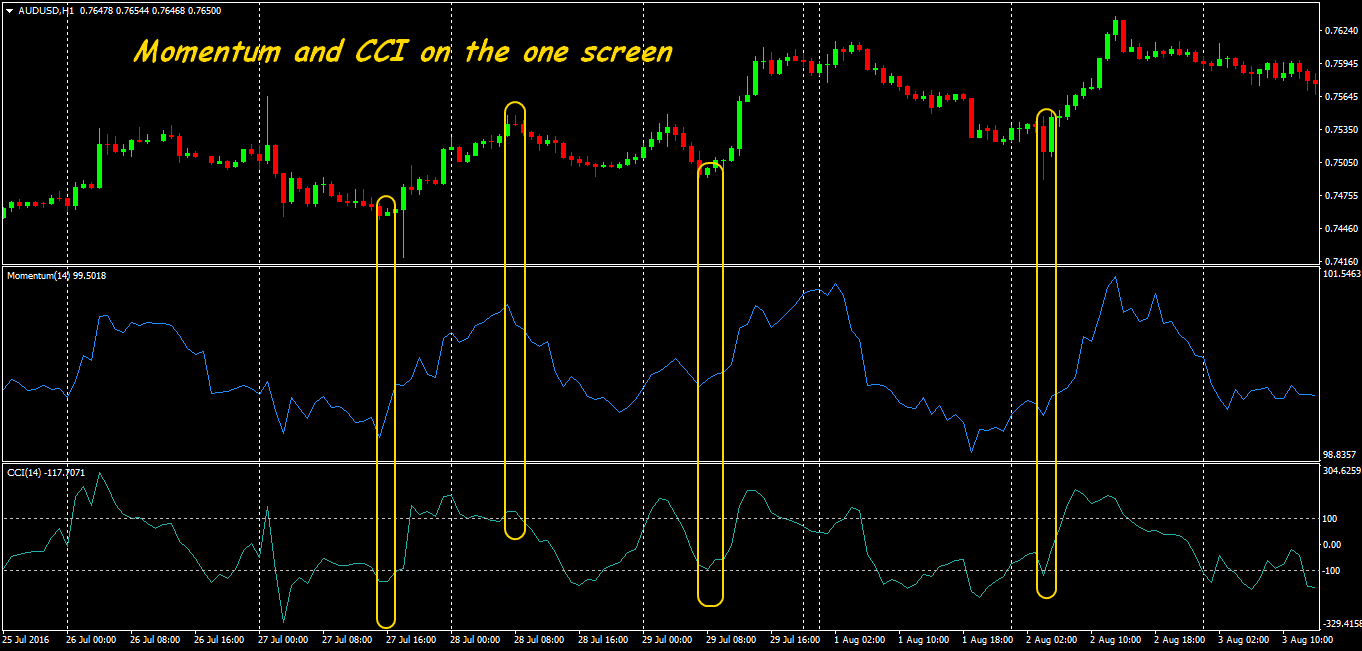
An analog of the Moment is the speed change indicator Rate of Change (ROC), which are calculated in relative units: ROC(n) = 100%Pi/Pi–n.
Actually, the interpretation of signals as Momentum and ROC is absolutely identical, only Momentum - the absolute indicator, dimensional the prices, and ROC - the relative indicator (dimensionless).
If it`s necessary to compare the force of two trends, then it`s worth using the ROC (n) oscillator. For specification of points of entry usually experiment with a Momentum method of calculation, for example, use a difference between two indicators with various sizes of the periods.
In case of the choice from all options the Momentum oscillator is the fastest, that is why it`s main shortcoming: unstable results in the case of speculative movements of the price.
CCI (Commodity Channel Index or index of the trade channel),
Mathematically this indicator normalizes the schedule Momentum, dividing its values into the maximum value of amplitude. A movement in an upper or lower zone signals that either consolidation, or recession is to occur (or growth - respectively).
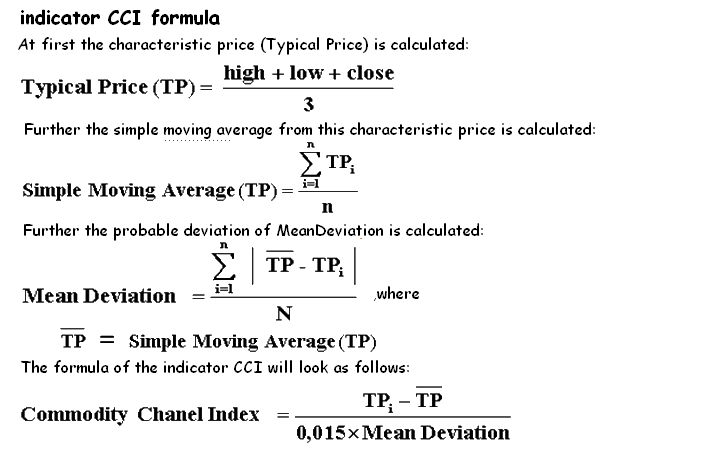
The line of the oscillator moves in the range from -100 to +100, critical zones can be allocated with levels. Trading signals are standard.
The main lack of CCI is it was created for the goods markets, and therefore most accurately works only at long, correct cyclic movements which on Forex are just difficult for distinguishing. Respectively, it`s difficult to pick up the optimum period of the oscillator, especially for currency assets.
An example of the trade system on the two oscillators
Practically all trade systems without trend indicators are unsustainable. The systems only on oscillators on the short timeframes because of abundance of false signals aren't simply unprofitable, and are even dangerous. That is, any ideas of a scalping without tracking of a trend on the periods below M15 – are rejected directly. Only strategies based on Awesome Oscillator can be more or less effective - exactly thanks to its trend calculation procedure. The system is supplemented with the filter in the form of RSI or Stochastics, and in case of successful matching of parameters, it is possible to compensate delay of the AO and rather effectively to cut off price noise. Usually recommend a ratio of parameters about 1:1,5, smaller parameter will track a trend, bigger – to filter false signals.
Trade asset: any currency pairs with stable volatility. Indicators: Awesome Oscillator (14), price Close, standard RSI (8). Timeframe: not below M15. Trading session: Europe, Europe-America, except the period of news. We hold the open transaction at least 1 hour.
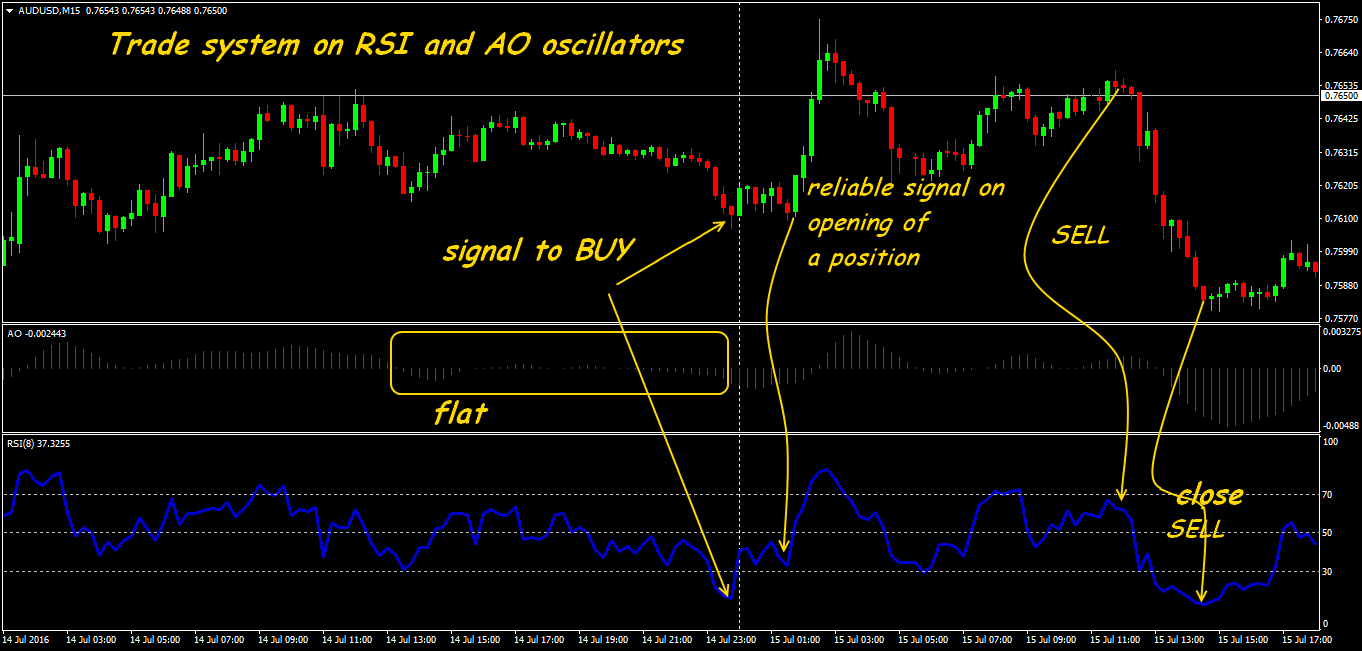 The interpretation of signals usual for standard indicators, but in general a signal on RSI appears earlier, and both on an entrance, and on closing of a position. The periods of a flat are better identified according to the histogram of Awesome Oscillator.
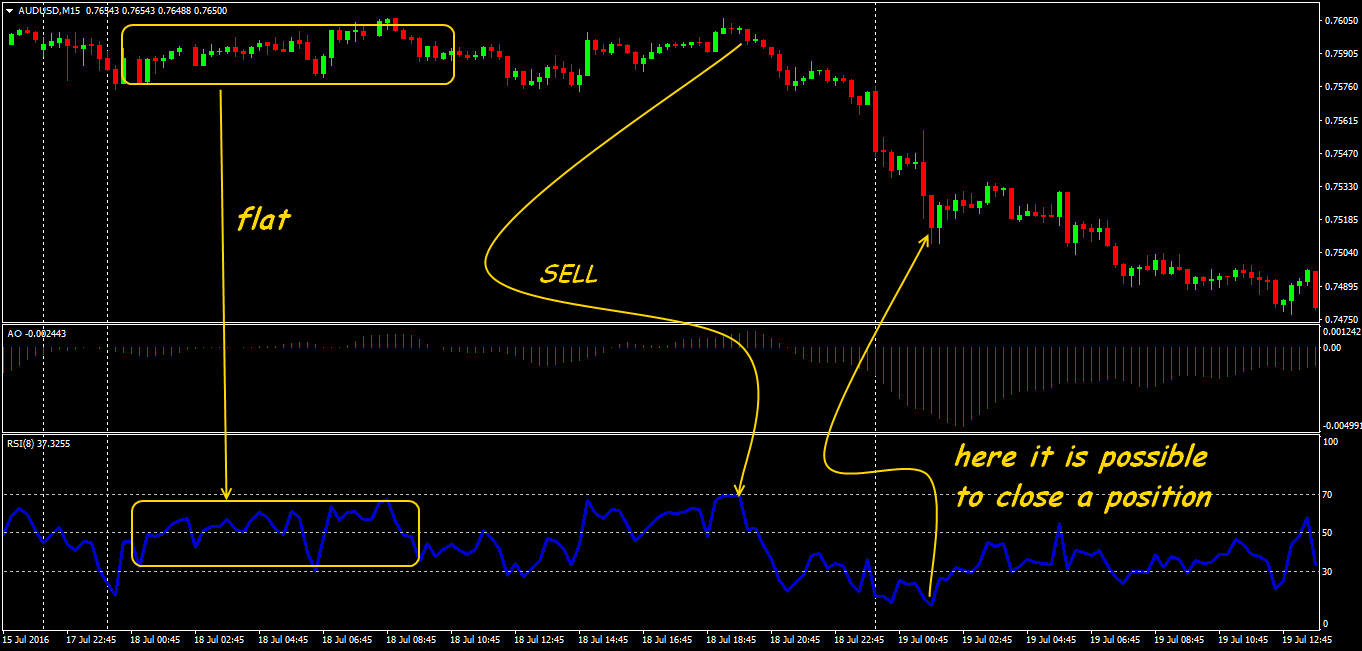 If there are no speculative throws (they are well visible on the RSI line, the AO histogram can`t react!), than on average about 50-70 points in a day on the tested AUD/USD are available. Crossing of the zero line is better not to trade. We calculate the stops depending on the daily average volatility of an asset, but at least 15-20 points. Primary take-profit – at least 20 points, in case of normal development of the situation - we start a trailing with a step of 10 points. When fixing the transaction it`s better to use a conservative method – on the first signal of a turn on the RSI line.
Several practical notes
In case of the choice of the oscillator you should understand that the main goal of the oscillators is not search of points of entry, but filtering noise, therefore:
- to reduce delay usually reduce the calculation period, but then the set of false signals appears;
- similarly: in case of increase in the period of calculation it`s possible to filter the noise more successfully, but at the same time delay increases;
- when the price approaches strong level (historical, round or Pivot), and also near bounders of a flat, the indications of the oscillator are especially important;
- the most useful effect of the oscillator is shown in the end (when easing) a trend, but the divergence analysis of the price/oscillator should carry out on the periods from H1 and above;
- combinations of identical oscillators with different parameters usually compensate delay, but the accuracy of trading signals decreases at the same time;
Though any oscillator in general tracks dynamics of the price, but a proportion of this movement is different, that is the return of the oscillator to a «normal» condition, as a rule, doesn't guarantee an immediate corresponding turn of the price. According to the classical theory the oscillators give the advancing signals, but in the modern market the practical value of such signals is obviously exaggerated. The possible benefit of turn signals is lost upon transition to the steady trend markets.
And as the conclusion …
Only the net statistics about the price is used in even the most difficult oscillator, without amounts and temporary features of an asset. It does oscillators by almost «omnivorous» technical tools, which work approximately equally at any markets. An example of the exotic choice of the oscillator is Aroon indicator.
Actually the base for full operation of the oscillator is the psychology of small players – they begin to join in the market with delay when the price already is in critical zones. Their losses help the price to turn in the direction, necessary for the market. The main practical goal of the oscillator not to show a signal, but to eliminate false, and correctly estimate the time and a situation wherein it appeared.
Even the right choice of the oscillators doesn't allow to construct full-fledged trade system, therefore for the use of the much publicized advancing effect of oscillators you should use several independent tools for the analysis.
Social button for Joomla