

")
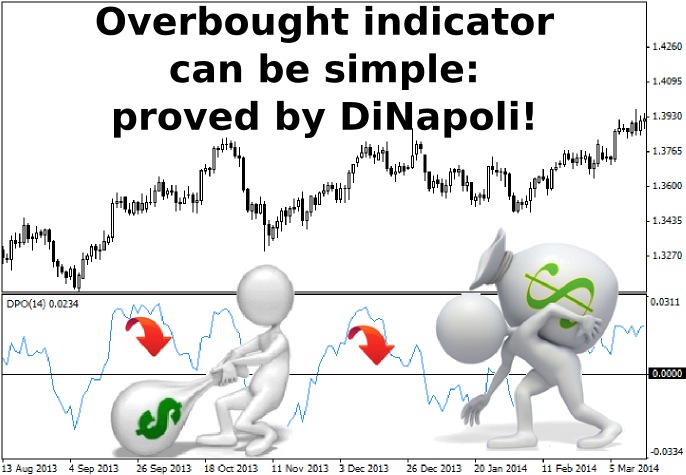
It is enough to answer two questions for successful trading on Forex: what trend is relevant now and when it will reverse. While even the novice can handle the first task, an overbought indicator will be useful to handle the second.
One of these algorithms is Detrended Oscillator, which was described by Joe DiNapoli in his book "Trading with DiNapoli Levels". But before proceeding to the description of its properties and characteristics of the work, let us recall some facts from the biography of the author of the material.
Joe started his career as a simple trader, and we must pay him tribute – for a long time (over 10 years) he just traded "in the black", and the idea to teach beginners came to him much later. Currently DiNapoli runs his own firm “Coast Investment Software, Inc.”, specializing in the development of analytical programs and traders training.
The only caveat to be remember is that Joe traded futures contracts on S&P500 and commodities rather than currency pairs, so some of his methods (for example, levels of the same name) work better is the stock market, since the behavior of speculators there is more predictable.
But there is good news – the overbought indicator is no exception to this rule, as exactly the same bullish and bearish trends form on Forex due to the fact that the uptrend for the numerator of a pair is a downtrend to its denominator.
What overbought indicator is intended for
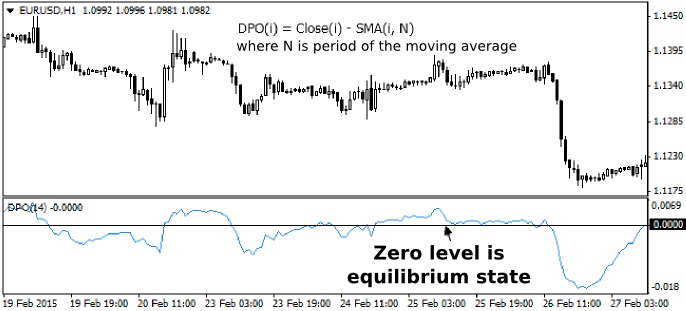
Any system can only be in one of two states – either at equilibrium or in the extreme position (with the plus or minus sign). But unlike physical closed systems for the equilibrium state of which the key parameters and boundaries can be calculated with high accuracy, the currency market situation is different.
The matter is that the market is not a closed system, as the number of participants on it is constantly changing, and that means only one thing – that the equilibrium point is constantly shifting. In other words, if we are observing the formation of the flat, it does not mean that next day the speculators will consider it as a true range. The overbought indicator eliminates these uncertainties and evaluates market dynamics:
If someone does not like such a primitive interpretation, we can draw a parallel with the cycles – the indicator identifies cyclical fluctuations over the specified period, but here it should be noted that the period of calculation is determined by the trader, so the basic calculations and preliminary optimization have to be done on your own.
Detrended Oscillator: old but reliable overbought indicator
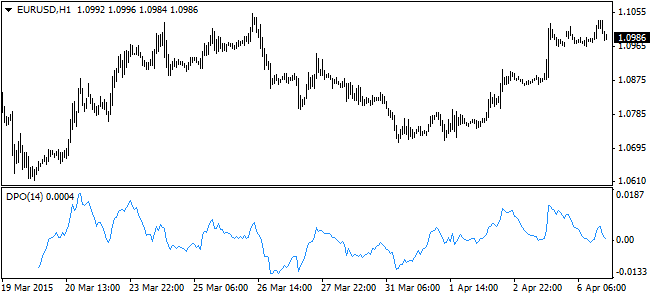
As Joe writes in his book, a detrended oscillator appeared long ago, so it is not known who owns its authorship, but judging by the formula calculation, the most likely source of its origin seems to be usual statistics. Speaking of the formula, this expert shows the difference between the current closing price of the bar and the average price for the period.
Currently, this elementary but effective overbought and oversold indicator is found in various versions – for example, the figure above shows its classic version, but in the following chart the same result is displayed as a histogram of the red and blue bars:
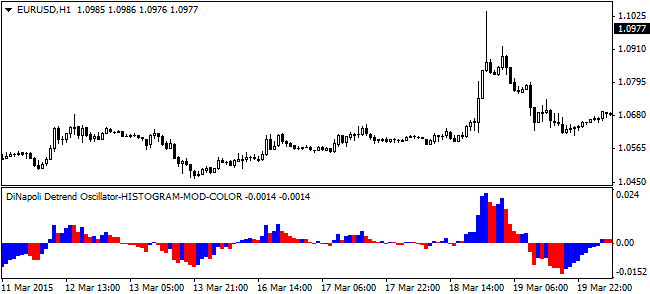
Selecting depends only on the preferences of the trader, but we recommend to work with the first version, since it has accustomed to build further markup (histogram bars will just get in the way), and if you experiment with modifications, there is a chance to find code errors.
Applying the overbought indicator
In the first part of the article we focused on the shift of the normal range of price fluctuations over time not without reason. DiNapoli also recommends to take as the borders of overbought/oversold not any permanent abstract figures (such as in the case of stochastic limit boundaries), but rather the average values of the last three extremes.
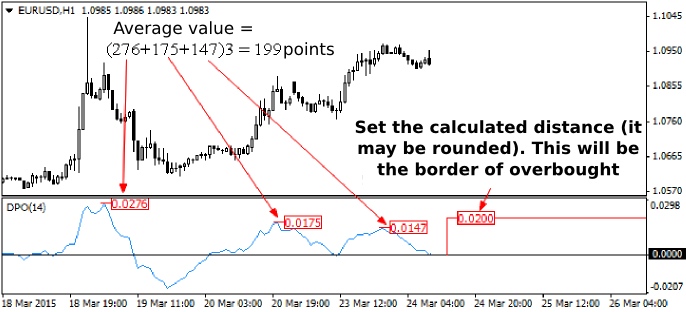
That's so simple – by calculating the "arithmetic mean" of multiple values, we get an objective assessment for the boundaries of price fluctuations in the near future. The resulting information can be used in several ways, ranging from the calculation of take-profit and stop-loss levels and ending with the filtering of false signals.
The overbought indicator in the context of the first strategy involves profit-taking as soon as the price passes the calculated distance, there’s nothing to explain here. But not all is so primitive, because DiNapoli drew attention to the fact that the range can be divided into several milestones – 70, 80 and 90%. This markup is built as follows:
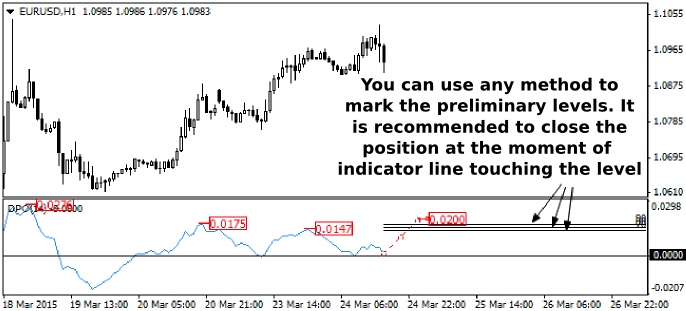
To calculate the levels, you can use any available means – ordinary calculator, indicator, maybe even a special expert advisor, but the easiest way for the MT4 user remains a modification of the Fibonacci grid. Recall that in the said tool you can remove Fibo levels and set any ratio at your discretion.
Now it is possible to control the position, depending on the magnitude of the risks and transaction method – for example, you can divide the deal into three orders, the first of which is closed immediately once the level of 70% is achieved (the stop for remaining two is moved to breakeven), the second at the touch of 80%, and a third when it reaches either 90% or 100%.
But while the considered method is useful mainly to "trenders", the second strategy seems interesting to speculators who are trading on the level breakthrough. In this case, it is not recommended to open a long position if the overbought/oversold indicator is near the upper limit of its range, and be careful with short positions at the lower end of the range, i.e. oscillator acts as a filter.
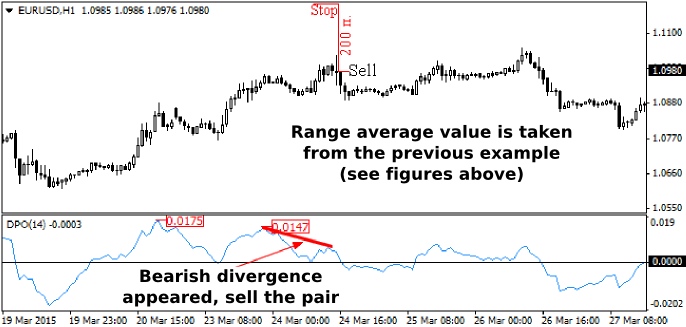
The next line of work can only formally be called "strategy", as Joe uses this word in his book. In fact, this algorithm is used only for placing stop-losses that are set at a distance equal to the average value of the Detrended Oscillator from the current prices.
Summary of findings and recommendations
As a small conclusion, we should mention that to improve the quality of modeling, you don’t have to combine the overbought and oversold indicator reviewed today with volatility indicators (many oscillators glitch with an increase in volatility – it is a known fact), because it already takes this factor into account due to the formula.
And it must be remembered that the prediction by the last three extremes gives only rough estimates of the range of fluctuations in the future, so we recommend eliminating the strong bursts of news from the calculations (news extreme can be eliminated and replaced by the previous). Converse is also true – if the release of important statistics is expected when opening the position, it is better to wait until the storm subsides in the market, and only then look closely to buy or sell.
Social button for Joomla