

")
Forex indicators
Forex indicators are auxiliary tools necessary for decision-making in difficult moments, when the behavior of a currency pair is ambiguous. This section provides classification and reviews of new and proven indicators, describes how they work and the settings, gives examples of use. Beginners will be interested in the guide for choosing indicators.
- Details
- Written by Admin
- Category: Forex indicators
- Hits: 6811

There’s one iron clad rule among traders, which everyone tries to learn at the very beginning of their Internet trading career. Yes, we all are well aware that “trend is your friend”. And we all know that opening in the direction of the main movement, or a trend, gives a greater chance of working out the correctness of the order. It’s a sin not to use this chance, because the likelihood of pullback at this point is lower than a development of the mainstream, or a trend. And chances of turning point are even less.
- Details
- Written by Admin
- Category: Forex indicators
- Hits: 5800
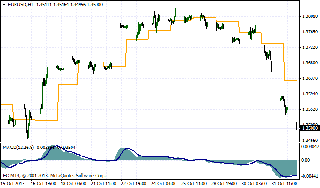
Trading on the foreign exchange market – like on any other, stock or commodity, market – always implies constant cash flows. There are always people on the market willing to buy or sell, and MFI indicator allows a trader to see the intensity of the incoming or outgoing cash flow in certain financial instrument – stock, currency, future or commodity. In simple words, when prices rise, the cash flow increases. On the contrary, when the prices fall, the cash flow shows negative dynamics.
- Details
- Written by Admin
- Category: Forex indicators
- Hits: 10560
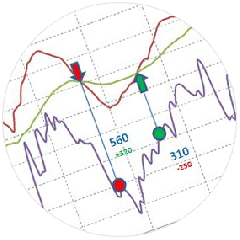
While on the subject of technical indicators, it is worth talking about an unusual tool for the market situation analysis, which is the AO indicator. AO stands for Awesome Oscillator. By the way, it was well-known Williams who created this indicator. This article will tell you what kind of a super indicator the AO is.
- Details
- Written by Admin
- Category: Forex indicators
- Hits: 6467
Forex trading on the levels of session openings and levels calculated according to certain algorithms has high priority. Since the horizontal lines primarily determine the maxima and minima, the degree of importance of using indicators with such analytic properties is quite high. A clear example of such an analytical tool is a Ku Klux indicator. Its operating principle is that it defines the orders opening levels based on the time of the trading session opening. Meanwhile, the indicator can be adjusted by focusing on any session or even opening of a particular exchange.
- Details
- Written by Admin
- Category: Forex indicators
- Hits: 6757
Let's imagine you one indicator, which would be very good and had the great popularity and a fairly high efficiency. This indicator is the truth. Now, let's assume you try, whether it is possible, to ensure that, this indicator had term improvement. That is, could be to increase its efficiency and optimize under any environment in the market. Is this possible? Theanswerisyes. Indicator osma is one of the such. This tool is not that other, as well as derived graphical tool to analyze price situation in the market. Let's take a look at him closer.
- Details
- Written by Admin
- Category: Forex indicators
- Hits: 5966
EMA is one of the most common indicators used in application of technical analysis. Despite being a lagging indicator, its application does well in trend directions.
So, let’s take a closer look at this indicator. Actually, it is a simple moving average – that is, a sum of the periods’ values divided by the amount. But since it is EMA, it means that the average is exponential. And this, in its turn, means that the exponential moving average registers not only the new values but also the old ones, thus reflecting the price movement more efficiently.
- Details
- Written by Jeremy Stanley
- Category: Forex indicators
- Hits: 4826
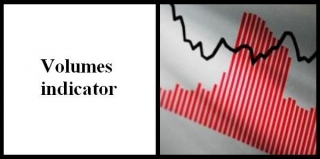
Nowadays there are huge amount of various types of indicators, which are used as graphical analysis tools. There is a kind or class of indicators, which show volumes, among all analytical tools based on the trend, overbought and oversold indicators.
- Details
- Written by Jeremy Stanley
- Category: Forex indicators
- Hits: 6342
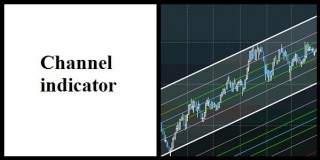
One of the most profitable methods of the online trading is trading in the middle of the channel. In fact it is the same trend, but it has more visible maximums and minimums. Of coarse, highs and lows always play one of the most important roles, especially when it comes to solid units. In this case we use a channel not only for finding a target. Our application of the channel includes the target for closing of the order and the opening of the new one, whether it is selling or purchasing. As a rule, the channel indicator is used for distinguishing the channel. But the range of indicators, which are used in the diapason trading, can be used for this purpose. This article explains the principle of analysis of some of such indicators.
- Details
- Written by Jeremy Stanley
- Category: Forex indicators
- Hits: 6828
Every trader most probably has tried Gann indicators in modern online trading. These are the raw of the instruments for the technical analysis, which is based on mathematic calculations, which may be beneficial if it is used properly. That's why many traders make these indicators the basis of their trading strategy.
- Details
- Written by Jeremy Stanley
- Category: Forex indicators
- Hits: 4883
A trading system based on the principle of divergence and convergence is the main basic element of technical analysis among the many basic approaches in online trading. Of course, if you search in the archives of the indicators, you can be found many instruments of such kind. The divergence indicator is indeed the fundamental indicator of the trading strategy, which does not dependent on the time interval. However, you should know the most common indicators of such trading systems.
- Details
- Written by Jeremy Stanley
- Category: Forex indicators
- Hits: 4983
Beginner traders often can meet such a thing as volatility in market reviews and comments on the current situation. Before we describe the volatility indicator and its properties, let’s see the definition of volatility itself. Volatility is a kind of statistic value that characterizes the ability of prices to change. This notion is a fundamental notion for risk managers and financial analysts. The higher the volatility is, the higher the risks are when one opens position on a specific instrument, and vice versa.
- Details
- Written by Jeremy Stanley
- Category: Forex indicators
- Hits: 4611
Recently, sound alert forex indicators have been implemented more in online trading. And this is probably not even the last stage of the development of the trade facilities. It should be clarified that the sound alerts are no more then the factor, which makes trading easier, but it is not the newest algorithm for price calculation. The beginner, who only learns Forex trading and hears the phrase “The Audio Alerting Forex Indicator”, might think anything. This is why we would like to describe what are the audio alerting Forex indicators and should they be used the basis for trading strategies.
- Details
- Written by Jeremy Stanley
- Category: Forex indicators
- Hits: 6994
By today, the number of various indicators is so large that is very difficult to revise them all or even follow their occurrence in the market. This situation was caused by the simple reason that for convinient trading traders use not only the calculation algorithms, but all other possible innovations as well. And they are all used. This variety includes color signals, the imposition of one indicator to another, beeps and the capital calculation formula.
- Details
- Written by Jeremy Stanley
- Category: Forex indicators
- Hits: 12083
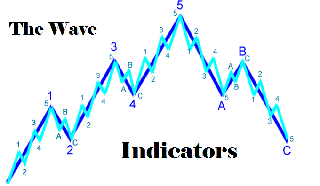
The wave indicators are the supporting analytical instruments, which principle of work is based on the Elliott Wave Theory. The Wave Theory is a rather unified theory, which examines the dynamics in exchange prices. Like any other applied discipline of technical analysis, the Elliott Wave Theory is based on the principle of finding a certain graphical patterns that can predict trends. Axiomatic apparatus of this theory comprises the original and logical assumptions on the behavior of the crowd.
- Details
- Written by Jeremy Stanley
- Category: Forex indicators
- Hits: 4906
Fibonacci indicators are one of the main instruments for analysis in the internet trading. It should be noted that besides the effectiveness of this analytical instrument, this indicator attracts the attention by the well-known validity of numbers, which are used to build this indicator. And, before we describe the Fibonacci indicators principle of work, it is worth to draw attention on the stricture of this indicator’ parameters.
- Details
- Written by Jeremy Stanley
- Category: Forex indicators
- Hits: 4482

This article describes a fairly widespread instrument of technical analysis which probably has become the classic instrument. Nowadays one can hardly meet a trader who is not familiar with such oscillator, as the RSI indicator. This abbreviation means the Relative Strength Index. The indicator shows the strength of the current trend and its possibility to be changed. Due to the fact that the RSI indicator is a very simple in use, it has been used by several generations of traders.
- Details
- Written by Jeremy Stanley
- Category: Forex indicators
- Hits: 5604
Each trader will be interested in building the trading system of his or her own one day. In fact each trader forms this system in his trading activity. Using trader calculator, each trader finds the best full lot volume as well as favorite trading instruments, indicators and consequently advisers. Each trader knows where to gain more benefit. The systemized plan which one follows is a trading system already. And spreads as well as credit leveraging allow making the trading system of the trader more effective. As a result, each trader finds one question - which indicators could be used for trading. The answer is in the indicators ranking.
- Details
- Written by Jeremy Stanley
- Category: Forex indicators
- Hits: 4226
Many traders know that trends in the market not long term, and most of the time the foreign exchange market is moving sideways or whatever it's called the state of "the flat". And the most effective in this market are the support and resistance levels, as well as channels that they form. This makes the LED channels forex one of the most popular indicators for traders. There are many strategies using these indicators, as well as various methods of construction of these channels, which have different properties and characteristics.
- Details
- Written by Jeremy Stanley
- Category: Forex indicators
- Hits: 5613
Strategies of FOREX can be very diverse. They can be based on the use of standard indicators, and can operate with the user equipment. Trading on the levels of support and resistance has always been a fairly common method of earnings from currency speculators.
That is why, at round values of certain price levels we often see increased activity and increasing volumes. Pivot SR Indicator for forex - is representative of a class of analytic tools, whose work is based on the calculation of the most significant levels. These levels are called - Pivot levels. At a given time interval Pivot levels are support and resistance.
- Details
- Written by Jeremy Stanley
- Category: Forex indicators
- Hits: 5365
It's no secret that successful forex trading one of the top priorities for the trader is to determine the direction of the market, or in other words the trend. Trend - purposeful movement in the market (up or down) certain financial instruments - currency futures, stocks or indices. Knowing the direction of the trend, the trader increases their chances of opening a successful transaction. Experienced traders can determine the presence of a trend on the schedule of prices, or using a forex trend indicators.